From strategy to algorithms: how our data science team makes better decisions with human data at scale

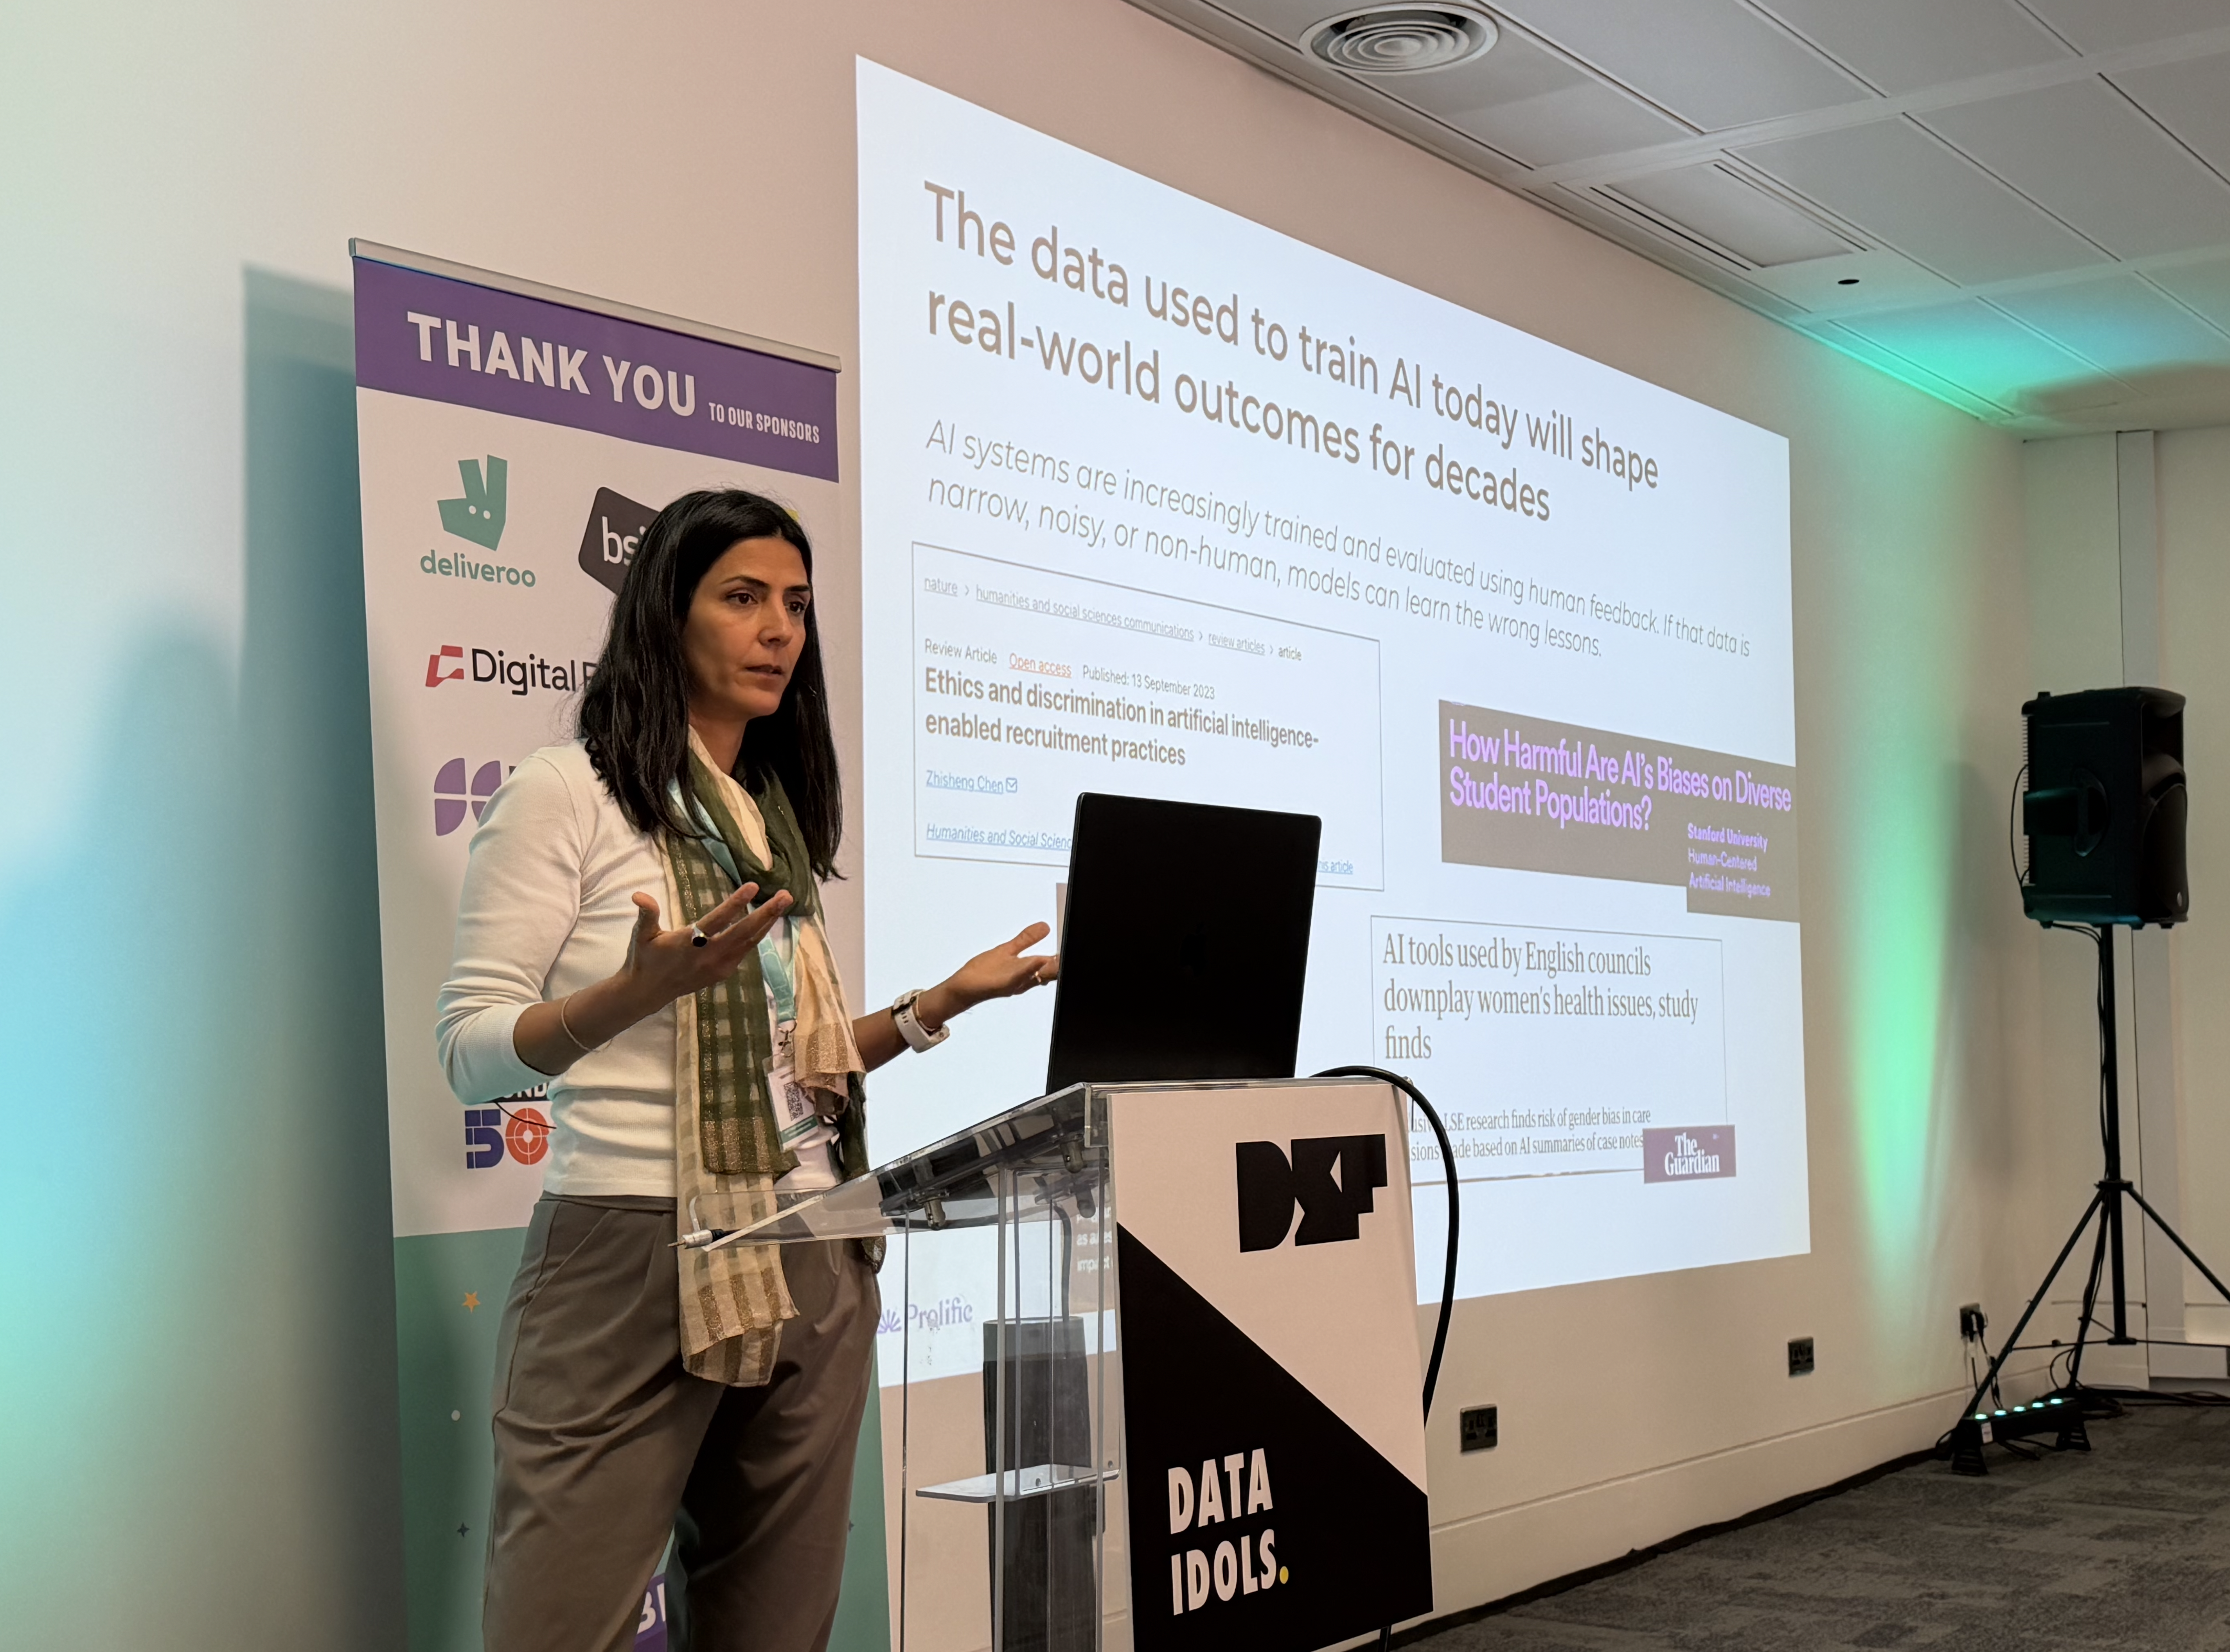
In May, Prolific's Director of Data Science and Analytics, Billur Engin, and Senior Data Scientist, Philip Soo, took the stage at Data Science Festival in London to answer a question most data teams wrestle with at some point: how do you run a data science and analytics function that stays true to your company's purpose?
Their answer is a practical framework built on three layers of decision-making, brought to life with examples from inside Prolific. You can watch the full talk here, or read on for the highlights.
Why human data carries so much responsibility
Prolific sits at the intersection of two worlds. Around 40% of online human academic research surveys run through the platform, generating roughly 40,000 citations to date. At the same time, frontier AI labs use Prolific to source the human data they need to train, evaluate, and safety-test their models. More than 35,000 organizations launch a new study on the platform every two minutes.
Both worlds depend on the same thing: data generated by the right humans, collected the right way. And as Billur argued on stage, the stakes of getting this wrong keep rising. AI doesn't learn in a vacuum. It learns from the data we provide, the examples we choose, and the people we ask to define what good looks like. Feed a model narrow, biased, or noisy data and it won't just learn the wrong patterns. It will amplify them.
Billur pointed to documented examples of this mirror effect across domains. Research published in Nature has shown AI recruitment tools scaling biases around gender and other characteristics. Harvard researchers have warned that gaps in healthcare access create gaps in health data, which algorithms then misread as absence of need. AI tutors risk misjudging students who express ideas in unfamiliar dialects. And reporting from the London School of Economics and the Guardian has found AI-generated social care summaries downplaying health issues, a subtle bias traceable back to the training data.
The message is simple. Human data becomes part of the decision-making, and errors at the data layer scale into errors across society.
What "better data" actually means
Prolific's purpose is building a better world with better data. Billur broke down what that means in practice along three dimensions.
Authentic humans
Data should come from real people, distinguished from automated or fraudulent responses. Prolific runs more than 50 quality and identity checks, adds new ones weekly, and applies them across the full participant lifecycle rather than at onboarding alone. Get this wrong and models learn synthetic preferences instead of real human judgment.
High attention
Real humans can still produce poor data. Participants who rush, skim, or game the system create noisy, inconsistent judgments, and models trained on them end up rewarding bad outputs and ignoring good ones.
Global representativeness
Better data reflects the real world across demographics, geographies, and backgrounds, rather than drawing from a small, overworked, homogeneous pool. Without this, AI performs worse for underrepresented groups and edge cases.
None of this happens by accident. It takes a data science function structured around it, which is where the framework comes in.
The three layers of decision-making
Billur and Philip's central observation is that organizations make three distinct types of decisions, and each needs different tools, different definitions of done, and a different owner.
Operational decisions: keeping the marketplace running
These are recurring, high-frequency, well-defined decisions, owned at Prolific by data analysts. Their job is to give every team the visibility to act with confidence. One example: the team closely monitors study fill times, so that when a study experiences friction, support teams can see it and intervene.
Philip illustrated this layer through Prolific's AI business, where the objective is delivering human data at the speed and quality that AI developers need. The operational metrics follow directly from that objective. Time to data measures the duration from initial project design to completed data collection. Data acceptance rate measures the percentage of submissions that pass quality checks and are approved by researchers. Both can be tracked per project, per client, or across the whole pool, and surfaced on dashboards so teams can adjust as they go.
Algorithmic decisions: data science as infrastructure
The second layer covers decisions made thousands of times a day, at a scale and speed no human team could match. These are owned by ML and AI scientists, and the goal is a system that acts consistently, encoding everything the team knows about data quality, participant intent, and risk. One example is participant pay recommendations, which draw on skills, availability, and past history to help studies launch with healthy rates.
The most vivid example came from Prolific's integrity team, whose mission is to ensure participants are who they say they are and engage authentically. Philip compared the challenge to the party game Mafia. Bad actors will join any platform, just as some players in Mafia secretly hold the villain card. Winning means observing behavioral signals from the moment someone arrives, evaluating those signals against their baseline, and pooling insights across observers. Prolific's equivalent is an ensemble of models, each monitoring different behavioral signals, combined to produce a confidence score on whether someone is a bad actor. Humans stay in the loop for escalations, but the system does the watching, from onboarding through every submission, covering everything from false identities and account farming to prohibited LLM use in written answers.
Strategic decisions: the rarest and most ambiguous
The third layer belongs to data scientists working directly with leadership. These decisions are infrequent, high stakes, and inherently ambiguous, and the output should be a recommendation rather than a report or a metric.
Philip walked through a supply example. Prolific has around 300,000 active participants, but researchers rarely want a generic sample. Filter down to active participants in Brazil and the pool is 4,000. Add two more criteria, such as people who give to charity and don't live with family, and it drops to 76. Part of the gap is real, and part is a data problem, since some attributes are self-declared and only answered by a fraction of participants.
The strategic questions stack up quickly. Should the team recruit 10,000 new Brazilian participants, re-engage churned ones, or target specific underrepresented demographics? Should it run an enrichment campaign asking existing participants to answer more profile questions, and which attributes need verification rather than self-declaration? And what is the return on each option, weighing acquisition and onboarding costs against lifetime value? Individual models can forecast demand, predict churn, or estimate lifetime value, but the strategic layer is the synthesis on top: turning all of it into a concrete recommendation, like how many participants to recruit next half, with which attributes, and how to allocate budget across acquisition, enrichment, and retention.
Four things to take back to your own team
Billur closed with a checklist for anyone running or working in a data function:
- Map your current backlog to the three layers. If a piece of work doesn't fit operational, algorithmic, or strategic decision-making, the brief isn't clear enough yet.
- Give every layer the right owner. Operational work needs data analysts, algorithmic work needs ML and AI scientists, and strategic work needs data scientists.
- Define what done means for each layer. Visibility, consistency, and recommendations are different outputs with different success criteria.
- Anchor everything back to organizational purpose. Otherwise you end up optimizing your system for metrics nobody believes in.
If the problems in this post sound like ones you'd enjoy working on, from supply modeling to bad actor detection, take a look at open roles in our Data and AI department.
Watch the full talk from Data Science Festival 2026, including the audience Q&A on LLM detection, demand forecasting, and participant retention.