Poll: Democrats lead by ~11 points. Here’s how we reached that number.

With only a week to go, Democrats are ahead in the congressional vote. We can't find a single recent poll that puts Republicans ahead on the generic congressional ballot. So, the question isn't whether Democrats are ahead, but by how much.
The Silver Bulletin average (updated October 23) has Democrats up 9.1 points, close to their high for the cycle, and 9.6 once it adjusts for likely voters. Republicans are facing more than the usual midterm penalty for holding the White House. Trump's approval has sunk into the low-to-mid 30s; the latest Reuters/Ipsos poll has it at 31%. Our own research suggests other issues, such as Republicans' positions on AI data centers, could carry an electoral cost.
More than 19 million Americans had already voted by October 23. Michael McDonald, who tracks early voting at the University of Florida, says turnout is running ahead of both 2022 and 2018, and 2018 had the highest midterm turnout in more than a century.
Will this hurt Republicans? It depends on whether a partisan enthusiasm gap exists. High turnout alone doesn’t reliably help either party, and early votes don't forecast the outcome: Republicans have tended to vote in larger numbers on Election Day.
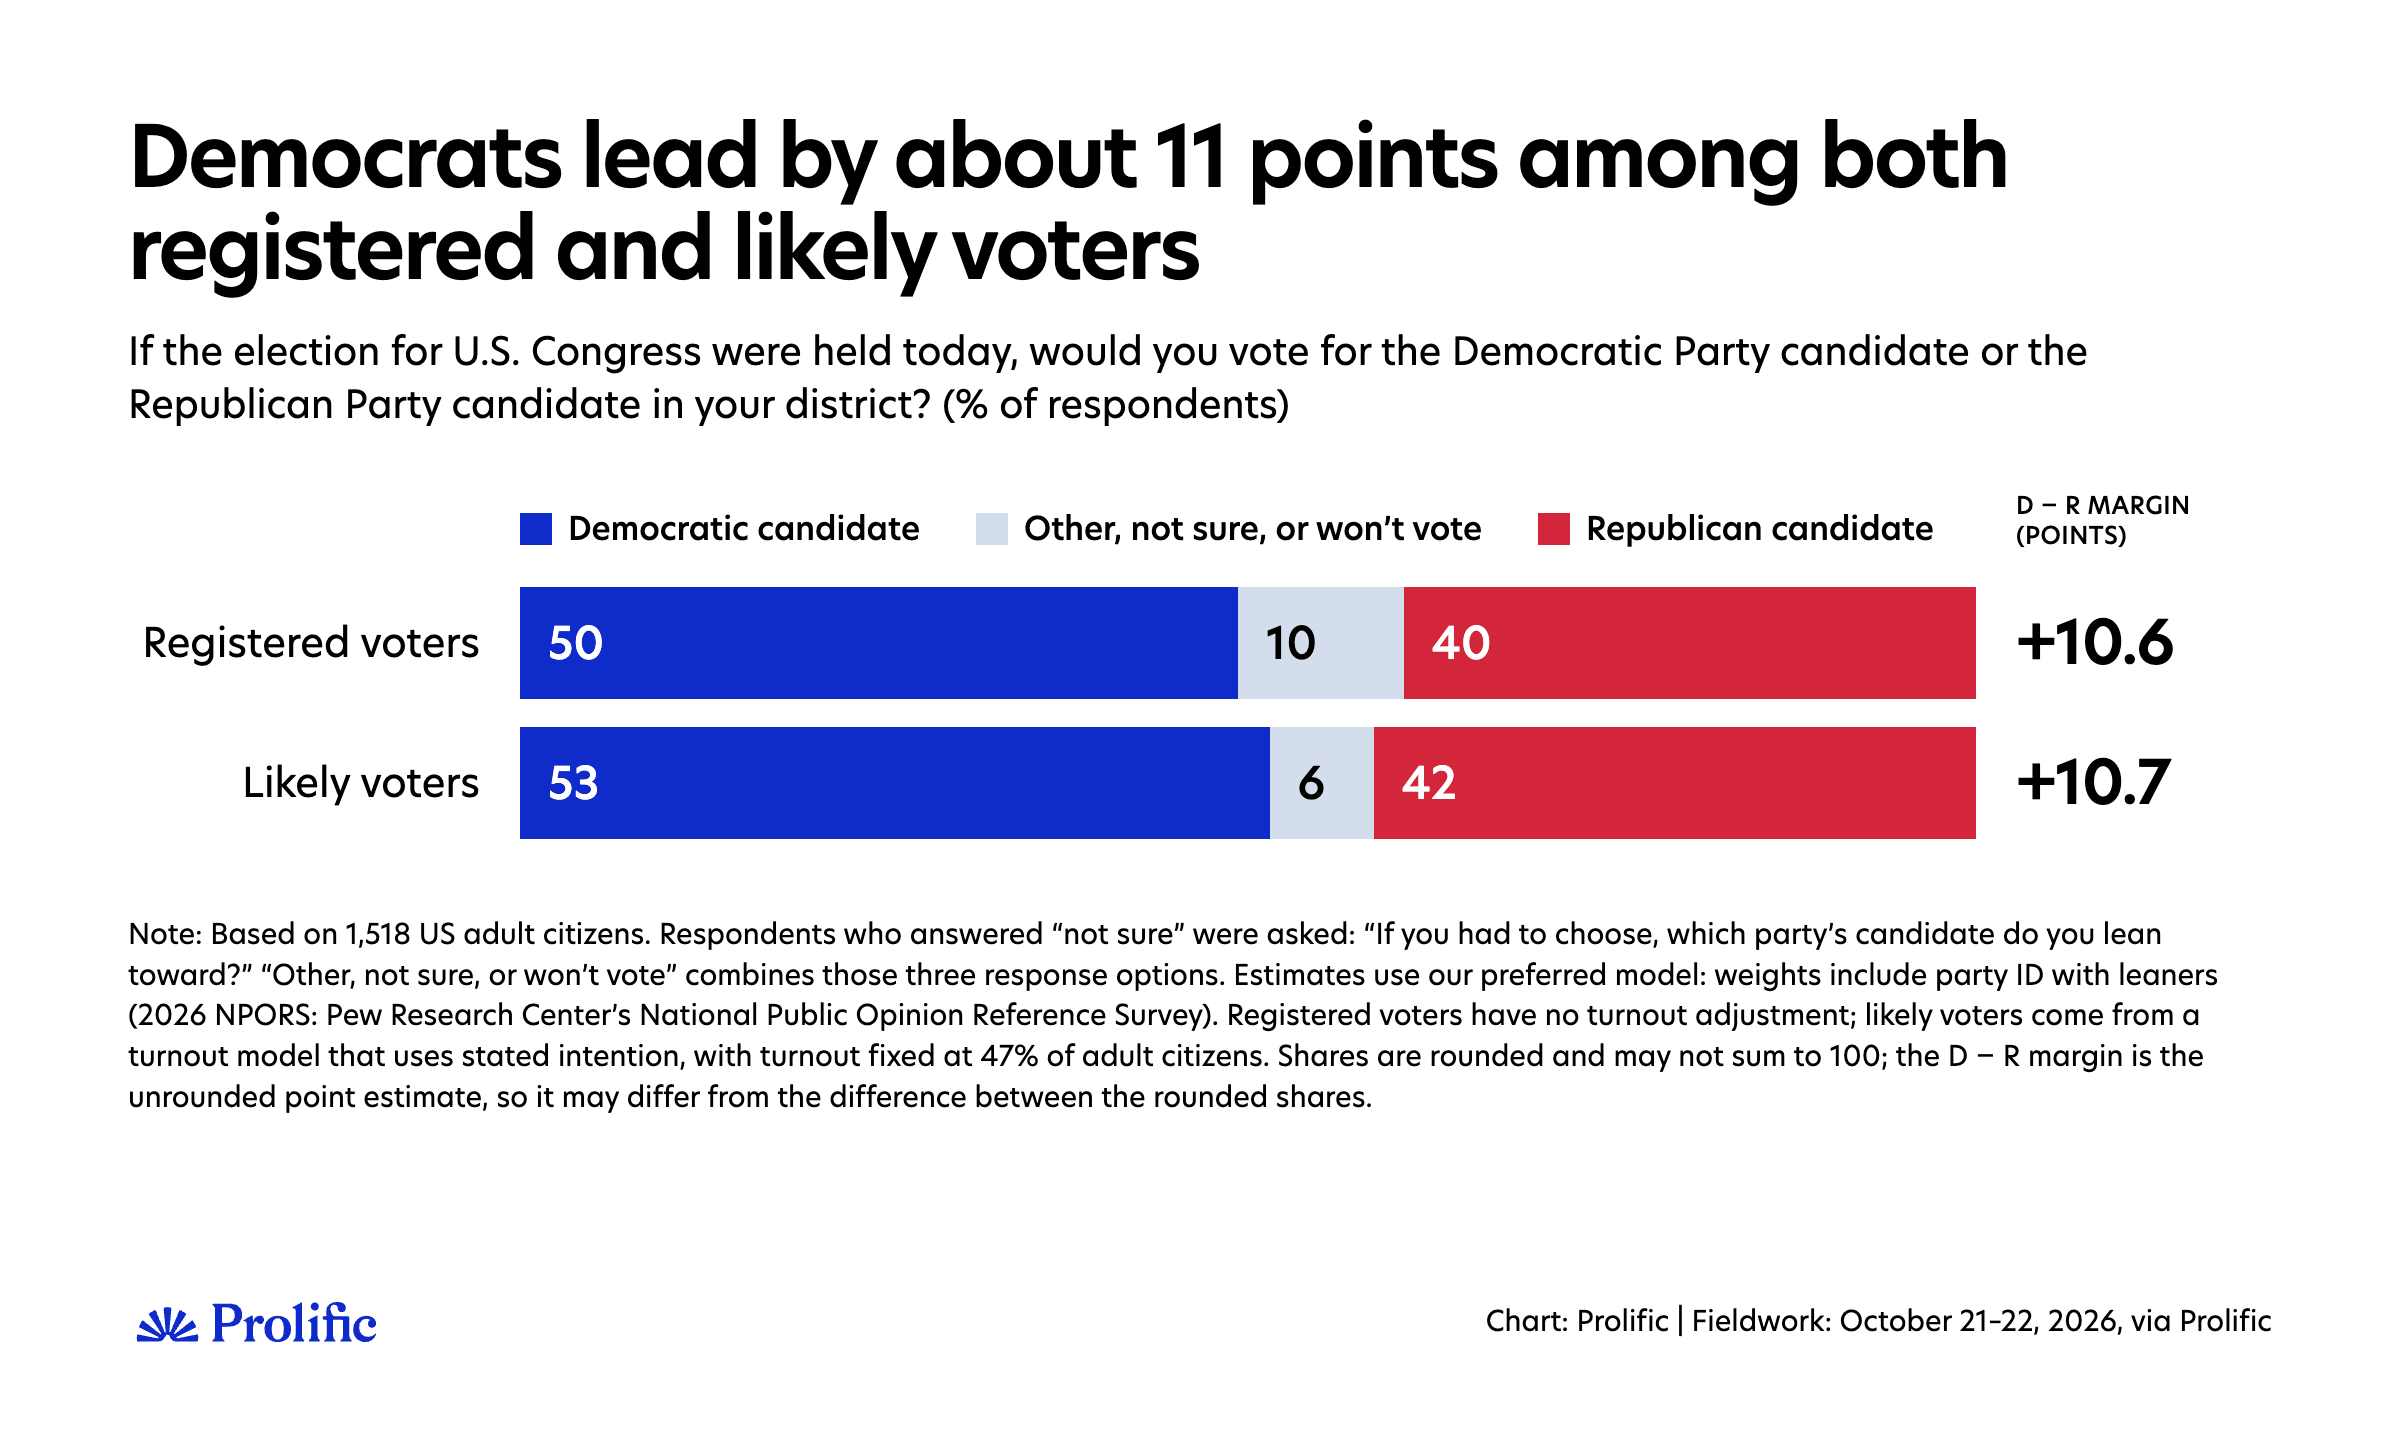
We ran our own poll of 1,518 US adult citizens on October 21–22 and found that Democrats lead under every reasonable way of reading our data. Our preferred weighting puts Democrats at 50% and Republicans at 40% among registered voters (Democrats 10.6 points ahead), while our preferred turnout model puts Democrats at 53% and Republicans at 42% among likely voters (Democrats 10.7 points ahead).
However, "every reasonable way" covers a lot of ground. Depending on a handful of decisions that every pollster has to make, none necessarily "wrong", our Democratic lead could go from about 5 points to about 15. Douglas Rivers made the same point about YouGov's polling earlier this month. He called it the problem of researcher degrees of freedom: when many defensible ways exist to analyze the same data, the range of answers is much wider than the margin of error suggests. As we show below, every pollster in the averages faces the same decisions, but makes them differently.
It’s worth showing that range openly for our own data, one decision at a time. So instead of putting out one number, this article walks through how we get from raw answers to an estimate, and what each step does to the Democratic lead. Where it helps, we show what other pollsters chose at the same step. That transparency matters in this election in particular.
There are good reasons to think Democrats will have a strong night. But how strong depends on choices that are all valid and defensible, and voters deserve to see how much each one is worth.
Here are the takeaways:
Democrats lead under every approach we tried. The question is by how much: anywhere from about 5 to about 15 points.
Among registered voters, the choice that matters is how we weight party ID. Depending on which Pew benchmark we use, and whether independents who lean towards a party count with that party, the Democratic lead goes from 8.6 to 12.2 points. Our preferred choice gives D+10.6.
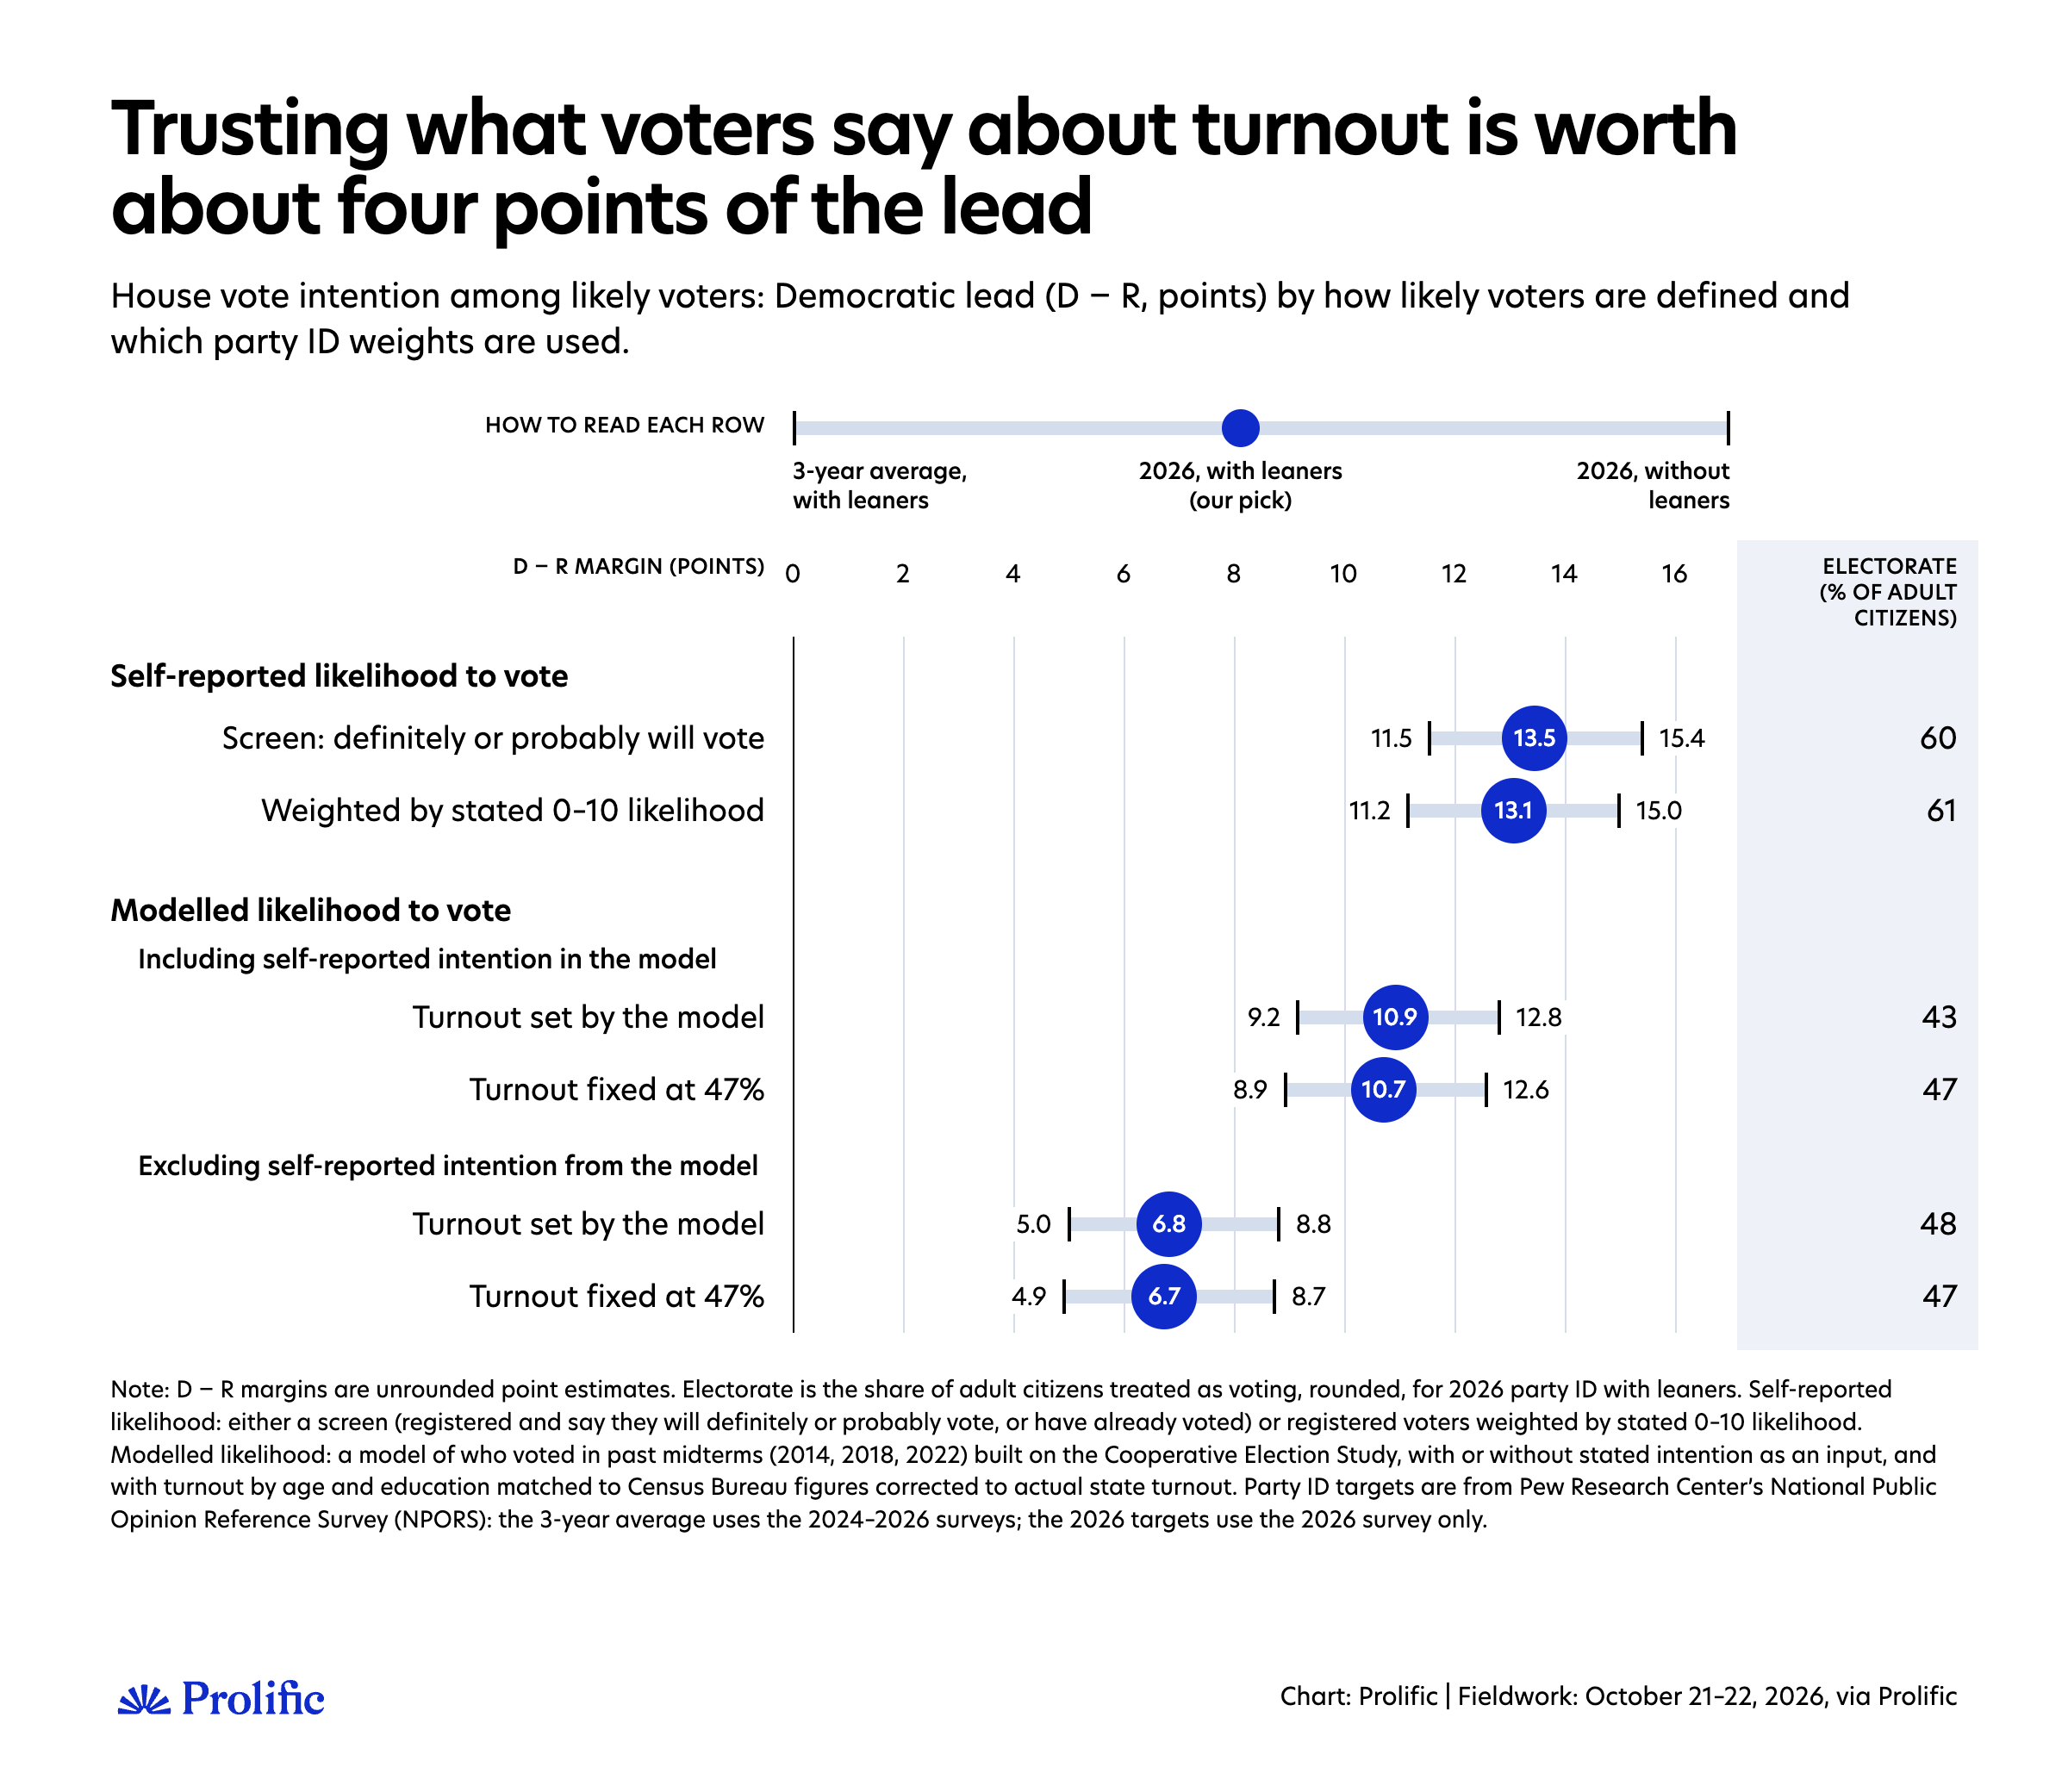
Among likely voters, what matters most is how much we trust people when they say they will vote. Taking them at their word gives D+13 to D+14. Ignoring what they say gives about D+7. Our preferred model, which gives stated intention the weight it earned in past midterms, gives D+10.7.
How many people vote matters far less than who votes. Moving expected turnout from 42% to 53% shifts the lead by a point at most.
People keen on politics, who are the ones most likely to answer polls, are more likely to say they will vote, a small experiment in our survey shows, which can inflate turnout intentions in polls. We find no clear sign that this favors either party.
Fancier weighting methods don't change the picture that much.
What the sample says without extra modeling
Before any modeling, pollsters need to collect the data. Most political polls are models, but before weighting starts, pollsters still have a lot to do to make the sample look like the population: drawing samples from voter files, using probability-based panels, or using rigorous non-probability sampling techniques. All are defensible if done well.
We developed our own in-house sampling approach for polling. We statistically model how people on Prolific differ from the US adult population on age, sex, race, education, region, and how they voted in 2024 and 2020.
We then invite people according to that model, so the sample is balanced on those characteristics and their combinations, more efficiently than quotas can manage. If not everyone invited participates, the design weights then only need to correct for groups that came in slightly above or below plan, similar to how traditional sampling works. In our internal tests, this method outperforms traditional sampling approaches for non-probability samples on a variety of political and non-political benchmarks.
We also need a rule for counting answers. We asked people who said they were unsure which party they lean toward, and we count those leaners with their party.
Most major pollsters do the same. It's also the version the Silver Bulletin average prefers. Not everyone does, though, which explains why some pollsters show slightly lower numbers for both Democrats and Republicans and a higher share of undecided voters. Everyone else, whether still unsure, voting for someone else, or not planning to vote, stays in our base. At this stage, we're describing the whole adult population and all registered voters, without assuming who will turn out to vote.
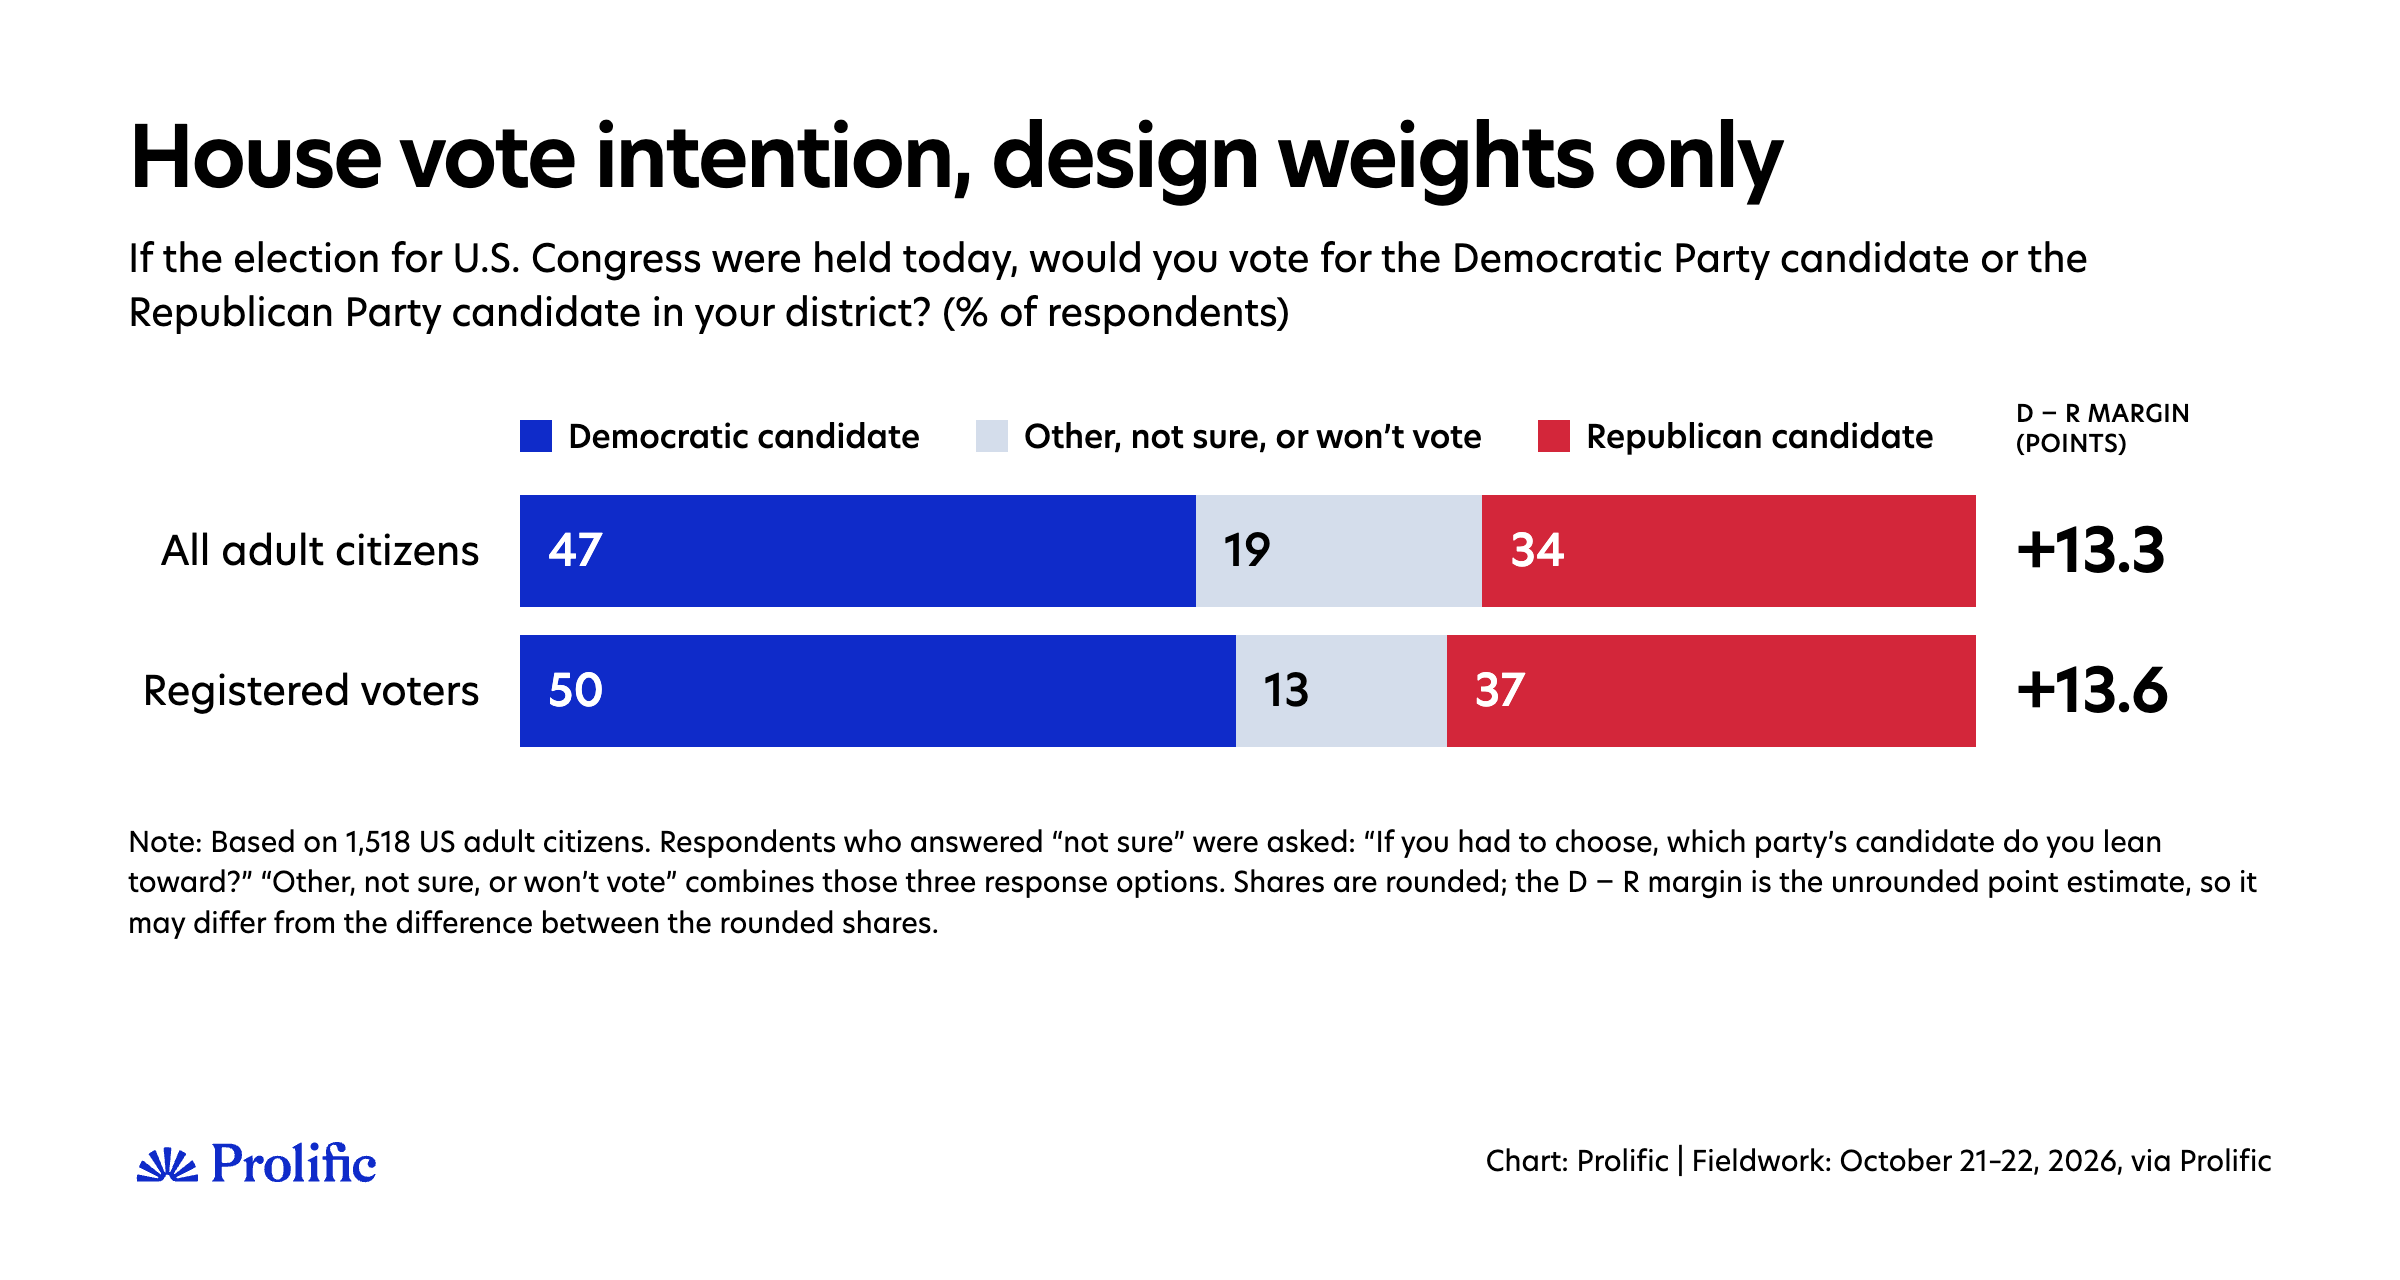
Using only the design weights and this approach to counting who will vote for each party, Democrats lead by 13.6 points among registered voters. That is above most polls, but not far off, given that no complex adjustment has been made yet.
No sample is perfect, however well designed. Some people are harder to reach than any model of the panel can anticipate, and a sample that matches the population on the characteristics we sampled on can still be off on others, politics above all. So, we adjust further.
Adjusting the sample: Party ID is the decision that matters
Apart from a few exceptions, the industry's standard way to correct a sample is raking: adjust the weights until the sample matches the population on a set of known characteristics. The question is which characteristics.
We start with socio-demographics. Like most careful pollsters, we don't just match each characteristic on its own. For the exact variables, their benchmarks, and how they are crossed, see the methodology at the end of the article. We also weight on political variables to correct for political imbalances that demographics alone cannot fix. Mainly, we weight on past votes, as is the norm. Of the October polls listed in the Silver Bulletin whose methods we could check, 18 of 22 weight to how people voted in 2024. We also weight by 2020 vote and registration status.
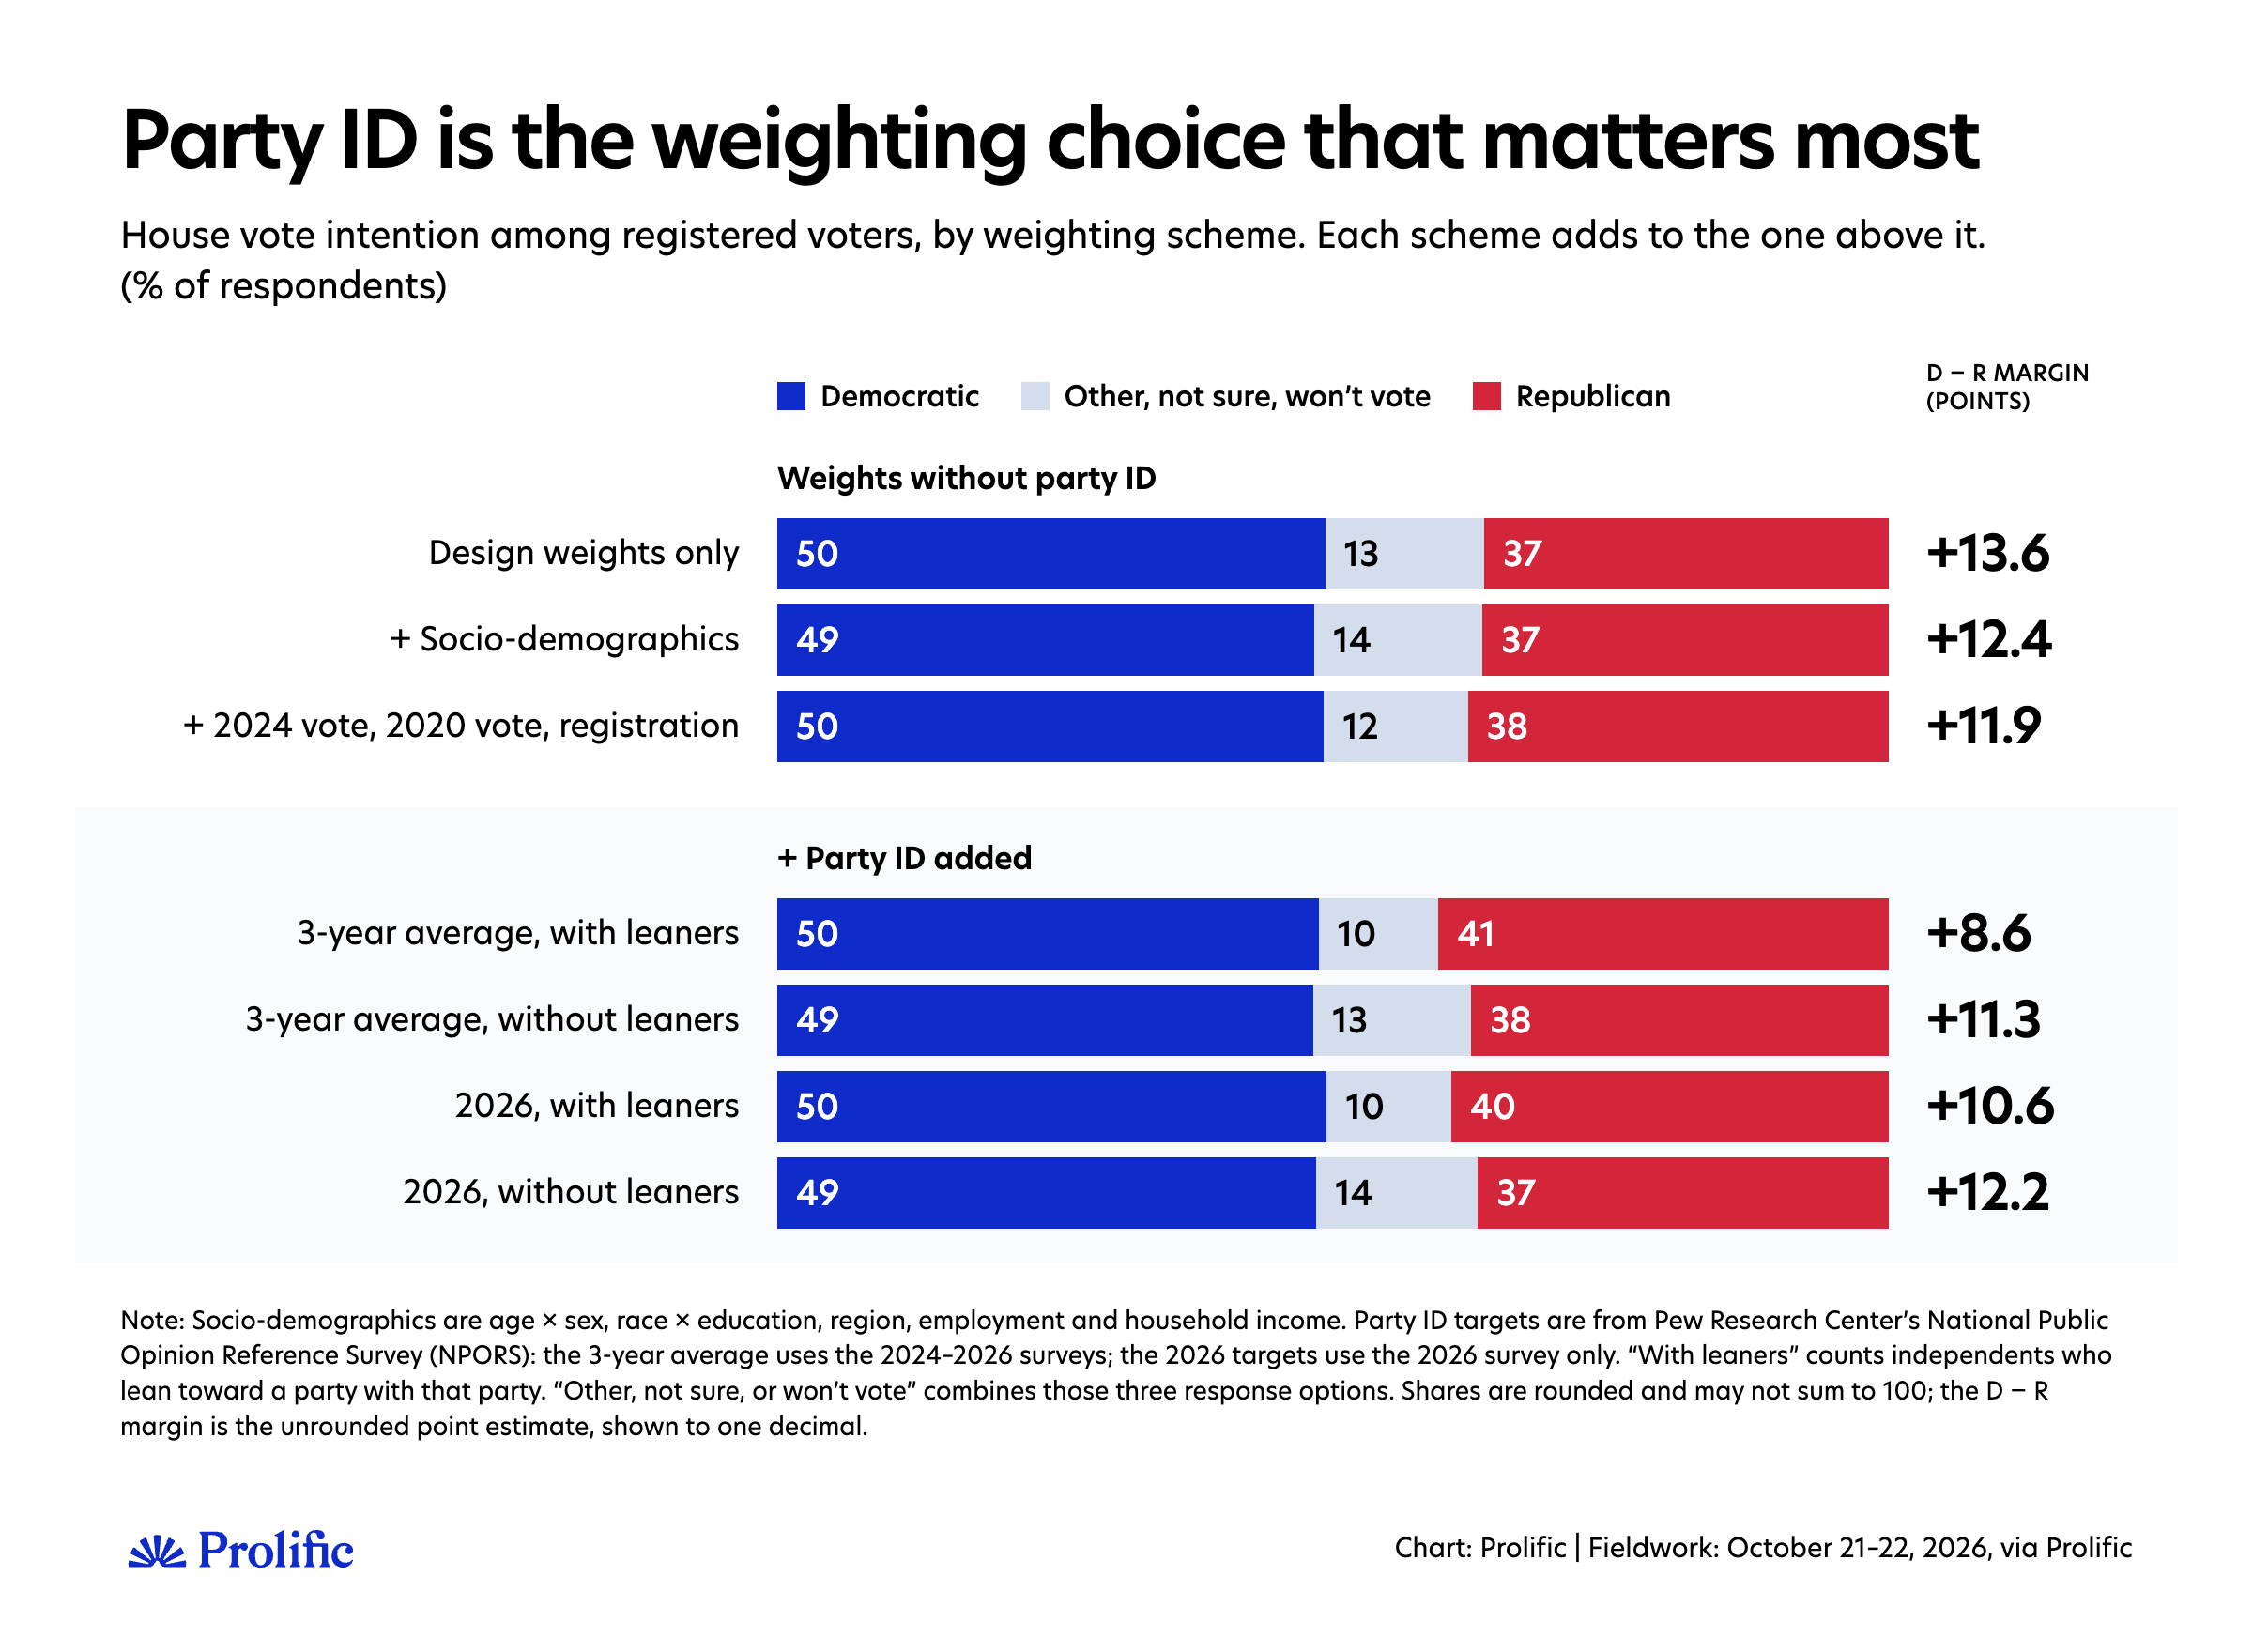
Among registered voters, socio-demographics alone reduce the Democratic advantage by a bit more than one point (from 13.6 to 12.4), mainly because they include variables our sampling doesn't use, such as income and employment, where some imbalance remained. Adding past vote and registration changes little overall, moving the advantage from 12.4 to 11.9 points, mainly because registration wasn't used at the sampling stage.
Beyond demographics and political behavior, our preferred weighting also includes party ID. Of the October polls whose methods we could check, 15 of 25 weight on party, including Pew, CNN/SSRS, Ipsos for ABC/Washington Post, or Verasight for Strength in Numbers. This is because past votes can only fix the political balance among people who voted last time; party ID covers voters and nonvoters alike, predicts vote choice strongly, and catches imbalances that demographics and past vote miss. The catch, as Pew's own methodologists note, is that no official count exists for how many Americans are Democrats or Republicans, so the target must come from a survey, and it shifts over time.
How party ID is used, however, is not settled in the industry, and it can significantly affect results. While some pollsters use party registration from voter files, Pew's NPORS is the reference survey most often used to estimate what share of Americans identify as Democrats, Republicans, or independents.
The problem with party ID is that it’s an attitude, and attitudes fluctuate over time, but Pew only collects these data once a year. Party identification has moved. In 2025, 31% of adults called themselves Republicans; in 2026, 28%. It seems reasonable to use the latest figure so that the modeled electorate has the most up-to-date partisan split. Nonetheless, since the data come from a (high-quality) survey, it also makes sense to be wary of noise in year-to-year movements.
One option is to average a few years of data, as Verasight does for G. Elliott Morris (three years of NPORS, to be concrete). That inevitably gives a more Republican target than using 2026 alone. We lean toward using 2026 data: external and internal evidence suggests an increase in people identifying as Democrats. But we could be wrong; both options are very defensible.
Also, many people who call themselves independents still lean towards a party when pressed. You can count them with their party or keep them as independents. Morris found this choice worth about two points in Verasight's data.
The case for counting leaners with their party is that they behave much like partisans: most vote for the party they lean towards nearly as reliably as people who identify with it outright. It also matches how we count vote intention: we ask undecided voters which way they lean. The case for keeping them separate is that leaning is the softer, more changeable part of partisanship. In a year when one party is unpopular, some of its usual leaners may stop leaning, and weighting them back to the usual pattern would undo a real change. We count leaners with their party: it’s consistent with how we count votes, and it is the more cautious choice here. But it’s still an informed choice that might be wrong.
What do we see in our models? Depending on the party target, registered voters go from D+8.6 (3-year average with leaners) to D+12.2 (2026 without leaners), with the 3-year average without leaners and 2026 with leaners in between, at D+11.3 and D+10.6, respectively. Our preferred approach, 2026 with leaners, lands at D+10.6. Essentially, the more Republican we believe the population actually is, the smaller the Democratic advantage.
Who will turn out to vote?
We could stop here and call it a day. However, not every registered voter will vote. So how can we know who, among the people who answered our survey, will actually vote? This is perhaps the hardest question in election polling today, and probably the most important this year. In a midterm, only about half of eligible adults vote: 46% in 2022 and 50% in 2018. Which half matters.
This year, there are good reasons to think the two halves don't look alike. Pew found in early October that Democratic supporters were 17 points more likely than Republican supporters to say they were "extremely motivated" to vote (63% vs 46%); at the same point in 2022, Republicans were slightly ahead. YouGov changed its definition of likely voters, replacing it with strict and loose versions, because its legacy definition showed Democrats 16 points ahead among likely voters at the end of September, compared with 6 points among registered voters.
It would be easy to stop there and conclude that the electorate will be bluer than the registered-voter numbers suggest. But there's a catch: what people say about whether they'll vote is a weak guide to whether they actually do. In a study of almost 30,000 interviews matched to voting records, Todd Rogers and Masahiko Aida found that between 29% and 54% of people who said they would not vote went on to vote anyway, and that past voting predicted turnout better than people's own predictions.
It might seem counterintuitive to ask people how likely they are to vote and then not fully trust the answer. But that's exactly what many careful pollsters do. Whether they use voter files, internal panel data, or high-quality surveys such as the Cooperative Election Study, most of the best pollsters try to close the gap between stated intentions and actual behavior with statistical modeling.
Modeling is not that simple either. Pollsters can do it in many different ways, even with the same data. In this article, we show you three approaches to deciding who will turn out to vote. We don’t use voter files or internal data from previous elections, so we can only model using externally available data:
Take people at their word. Count as likely voters those who are registered and say they will definitely or probably vote, or have already voted.
Weight by stated likelihood. Use the 0–10 scale directly, so someone who says 7 counts as 70% of a voter.
Model it. Use a model of who actually voted in past midterms (2014, 2018, and 2022), trained on the Cooperative Election Study, where turnout was checked against voting records. It predicts turnout from past vote, registration, age, education, race, and sex, with or without people's stated intention. Turnout by age and education matches the official pattern from the Census Bureau survey, corrected to actual state turnout following Hur and Achen.
What does our data tell us about this choice?
First, using 2026 with leaners as the party ID target, taking people at their word gives D+13.5 (self-reported screen) and D+13.1 (weighted by self-reported likelihood to vote). This approach also implies that about 60% of adult citizens will vote, which is highly unlikely. Given the enthusiasm gap between Democrats and Republicans, it also assumes that many more Democrats than Republicans will turn out.
Second, a model trained on the Cooperative Election Study over three midterms yields a smaller Democratic advantage. The main difference is whether we include stated intention. With stated intention, Democrats lead by 10.7 points (52.6% to 41.9%) when turnout is fixed at 47%, or 10.9 when the model sets turnout itself (at about 43%). Without it, the lead drops to 6.7 points (49.3% to 42.6%), or 6.8 if the model sets turnout itself (at about 48%).
Why leave stated intention out? Because, as Rogers and Aida found, it’s a weaker guide than past behavior, and because the people who answer polls are more likely to say they’ll vote than the population as a whole (more on that below). In the UK, where polls badly overstated turnout in 2024, YouGov now models turnout "purely on demographics" rather than on stated likelihood.
Why keep it? Because it still carries information that past votes and demographics don't. It’s the only thing in the model that can pick up a cycle in which one side is unusually motivated, which is exactly what we’re seeing this year. Including it in a model, rather than taking it at face value, means it gets only as much weight as it earned in predicting who actually voted in past midterms.
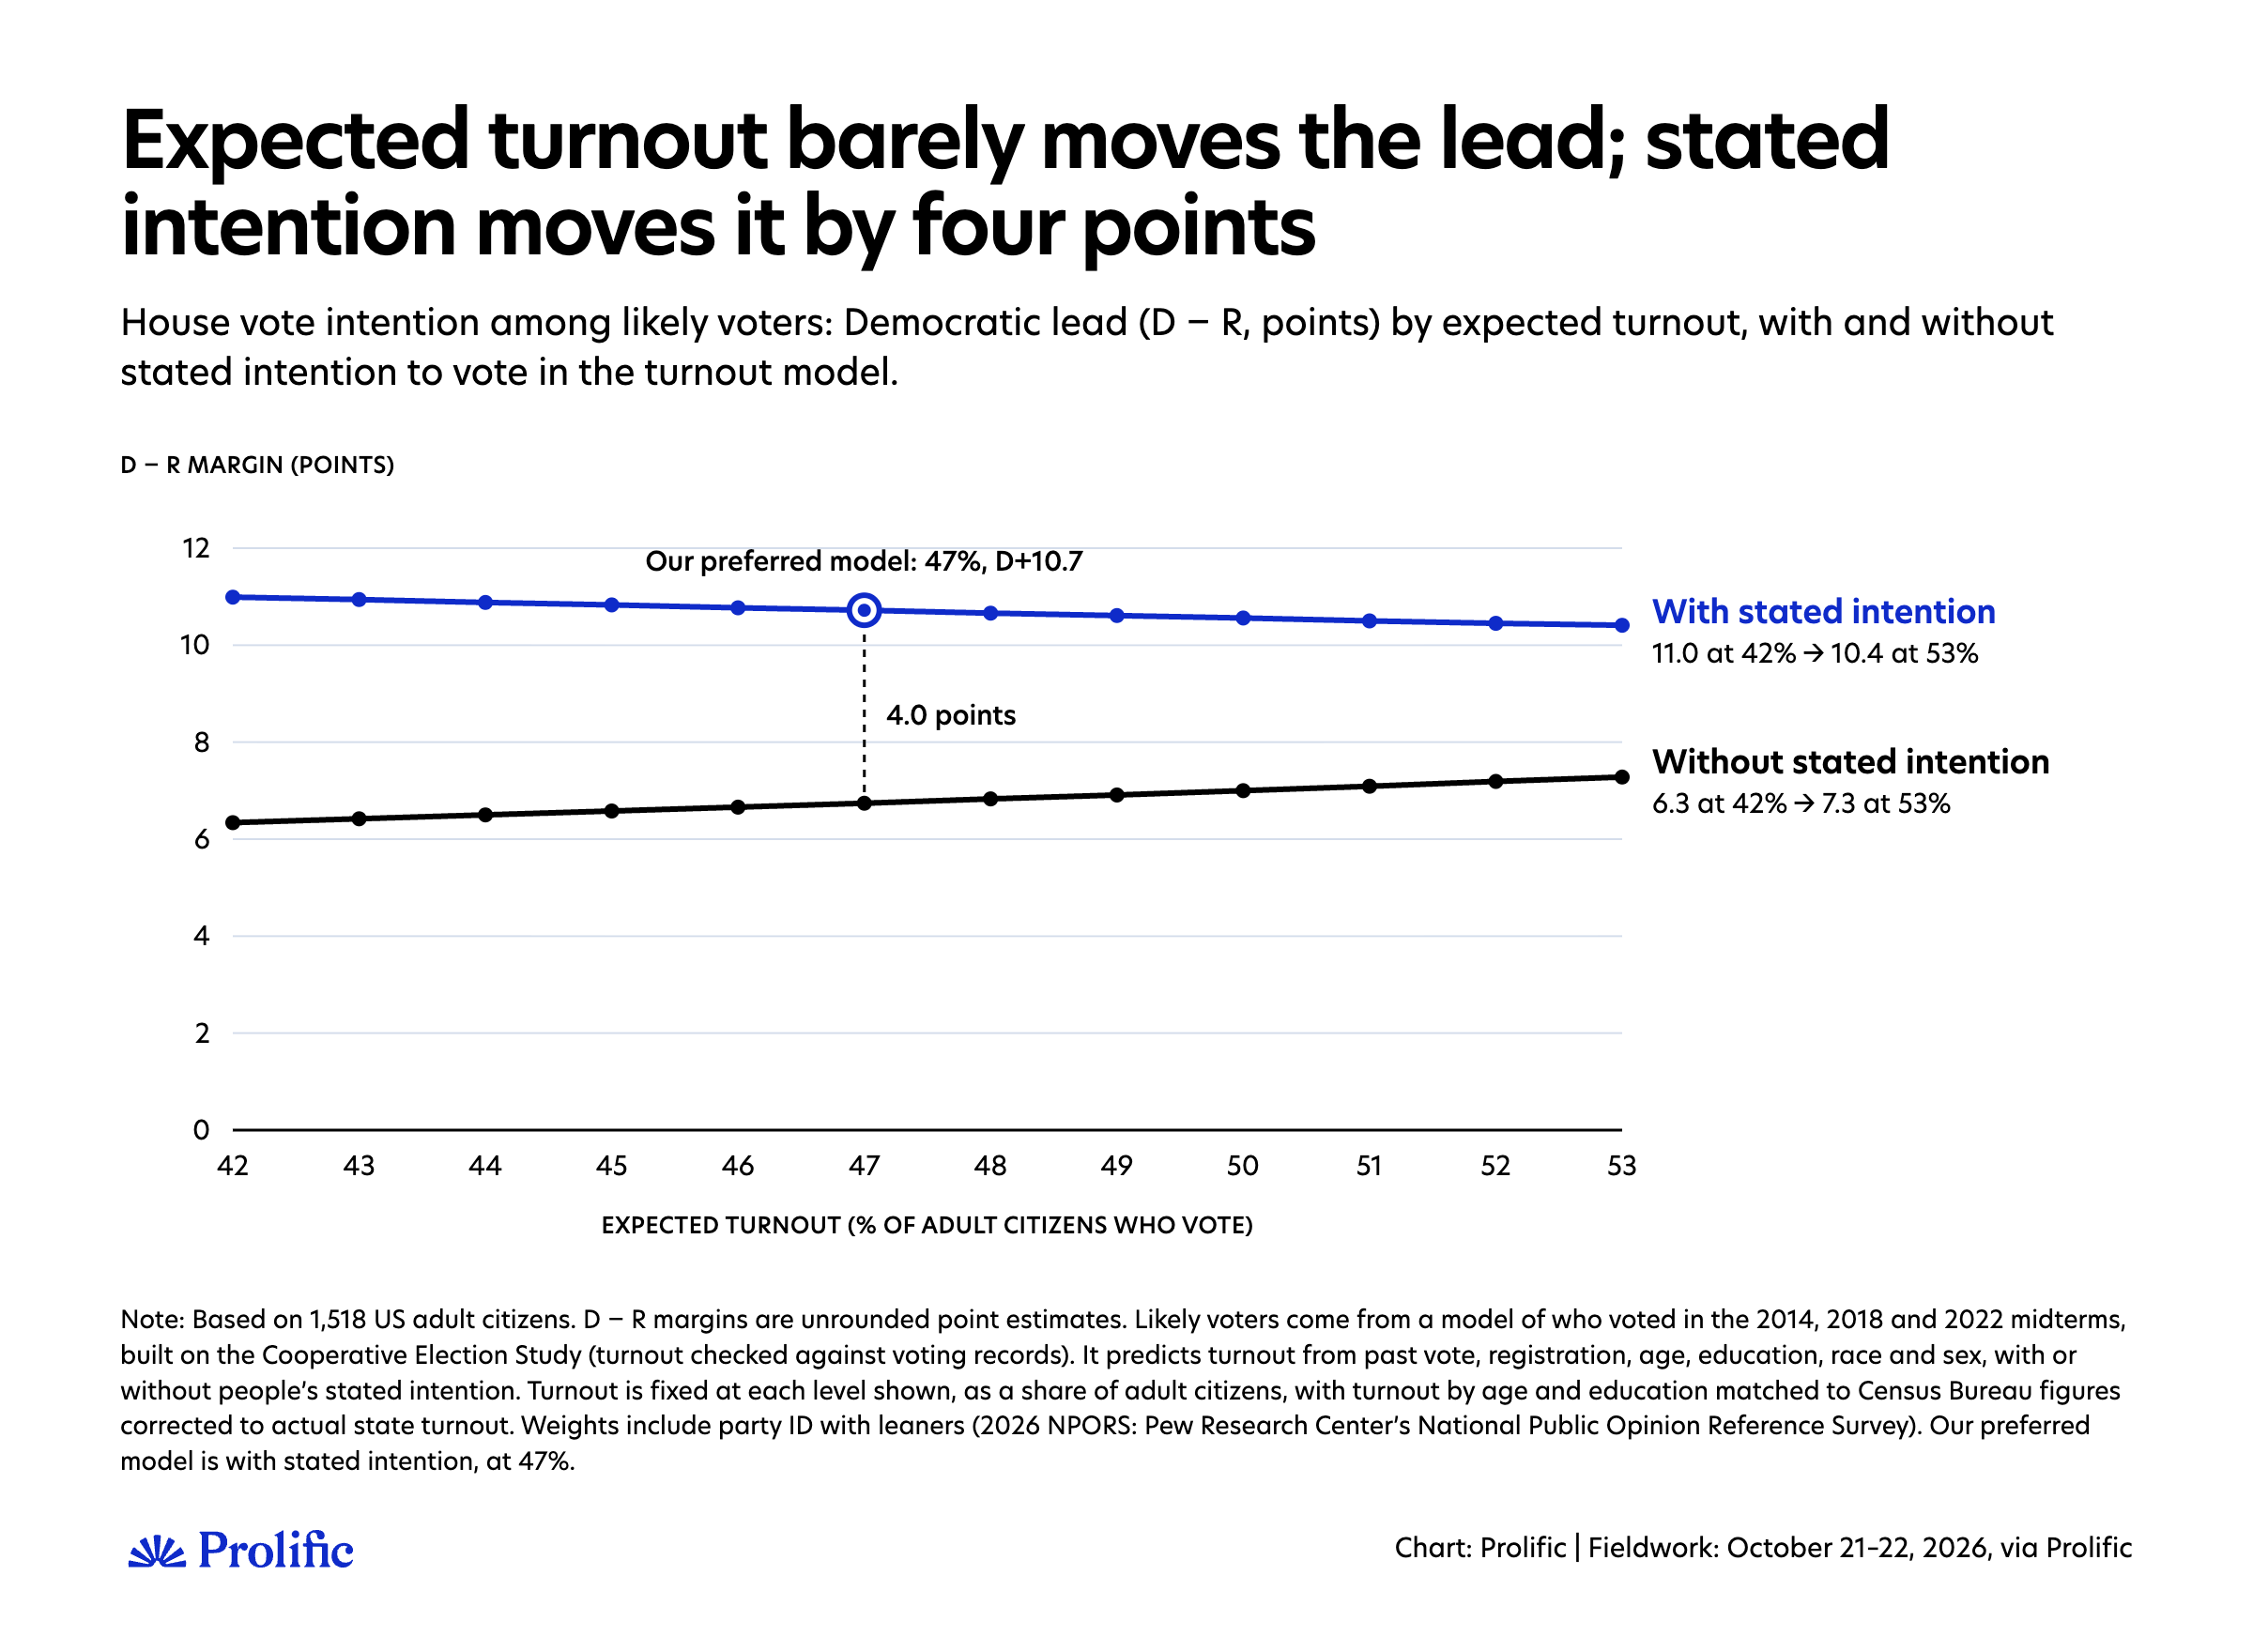
Once we’ve modeled the likelihood to vote, the exact level of turnout we expect doesn’t matter much. Moving expected turnout from 42% to 53% changes the Democratic lead by at most a point, and in opposite directions for the two models.
With stated intention, the lead shrinks slightly, from 11.0 to 10.4 points. As turnout rises, the model adds people who are less sure they'll vote, and since Democrats are the more enthusiastic group, these extra voters are less Democratic than those already counted (the voters added between 42% and 53% favor Democrats by about 8 points).
Without stated intention, the lead grows slightly, from 6.3 to 7.3 points. This model ranks people by past voting and demographics, so it counts older, habitual voters first, who lean Republican, then adds younger, less regular voters, who lean Democratic, as turnout rises (the added voters favor Democrats by about 11 points).
Plenty of evidence shows people aren’t very good at predicting whether they’ll end up voting. But this year's enthusiasm gap is too large, and too consistent across sources (polls, primaries and the early vote), to throw stated intention away.
So, our preferred approach is the turnout model with stated intention, which uses what people tell us but discounts it by how well it predicted turnout in past midterms. We fix turnout at 47%, close to 2022 levels and the setting we fixed before fieldwork. Early voting suggests turnout could be higher, but as the chart shows, this barely matters: at 50% the lead is 10.6 instead of 10.7.
We might be wrong, however. Models learn from past elections. If this year is very different and Democrats are indeed much more likely to vote than past data would suggest, we will underestimate their advantage, which could be around D+13 or D+14. The opposite can also be true. People might be worse at predicting their likelihood to vote this year than in previous ones, which would mean our approach is too favorable to Democrats. Our models that ignore what people say about whether they will vote put Democrats about 7 points ahead.
We tested how this can go wrong. Trained only on the 2014 and 2022 midterms, our turnout model understated Democrats’ House margin in the 2018 wave by about 2 points: Democrats who said they would definitely vote turned out a little more than the model expected, and Republicans who said the same a little less. If our model repeated that error this year, our estimate would move from D+10.7 to D+12.0; if the error ran the other way, to D+9.4. That doesn’t tell us which way this year’s error will go, but it shows one way a model built on past elections can miss.
So which is right? No one will know until the votes are counted. For now, our job is to make the choices we believe make the most sense. The enthusiasm gap in this cycle is large and shows up everywhere. But so does the evidence that stated intention exaggerates. We can say that this one choice, trusting stated intention or not, is worth about 4 points, more than anything else in this article.
Should we worry our respondents are different in ways weighting can't fix?
This all rests on the assumption that once we account for who people are (demographics, past vote, party, registration), the people who answer our poll think and behave like those who don’t. If people take part because of what we’re measuring, for instance, if politically eager people are more likely to answer a political poll, no amount of weighting will fully fix it. Academics call this ‘non-ignorable nonresponse’.
We built a small experiment inspired by Michael Bailey’s work (Polling at a Crossroads and a 2025 paper). We randomly selected half of the people who started our survey and first asked them which topic they’d like to answer questions about: movies, politics, health, or sports. 46% picked politics, compared with about 36% in Bailey’s own study. Unlike in his design, everyone then answered all our political questions, so we can see directly how the less politically eager answer.
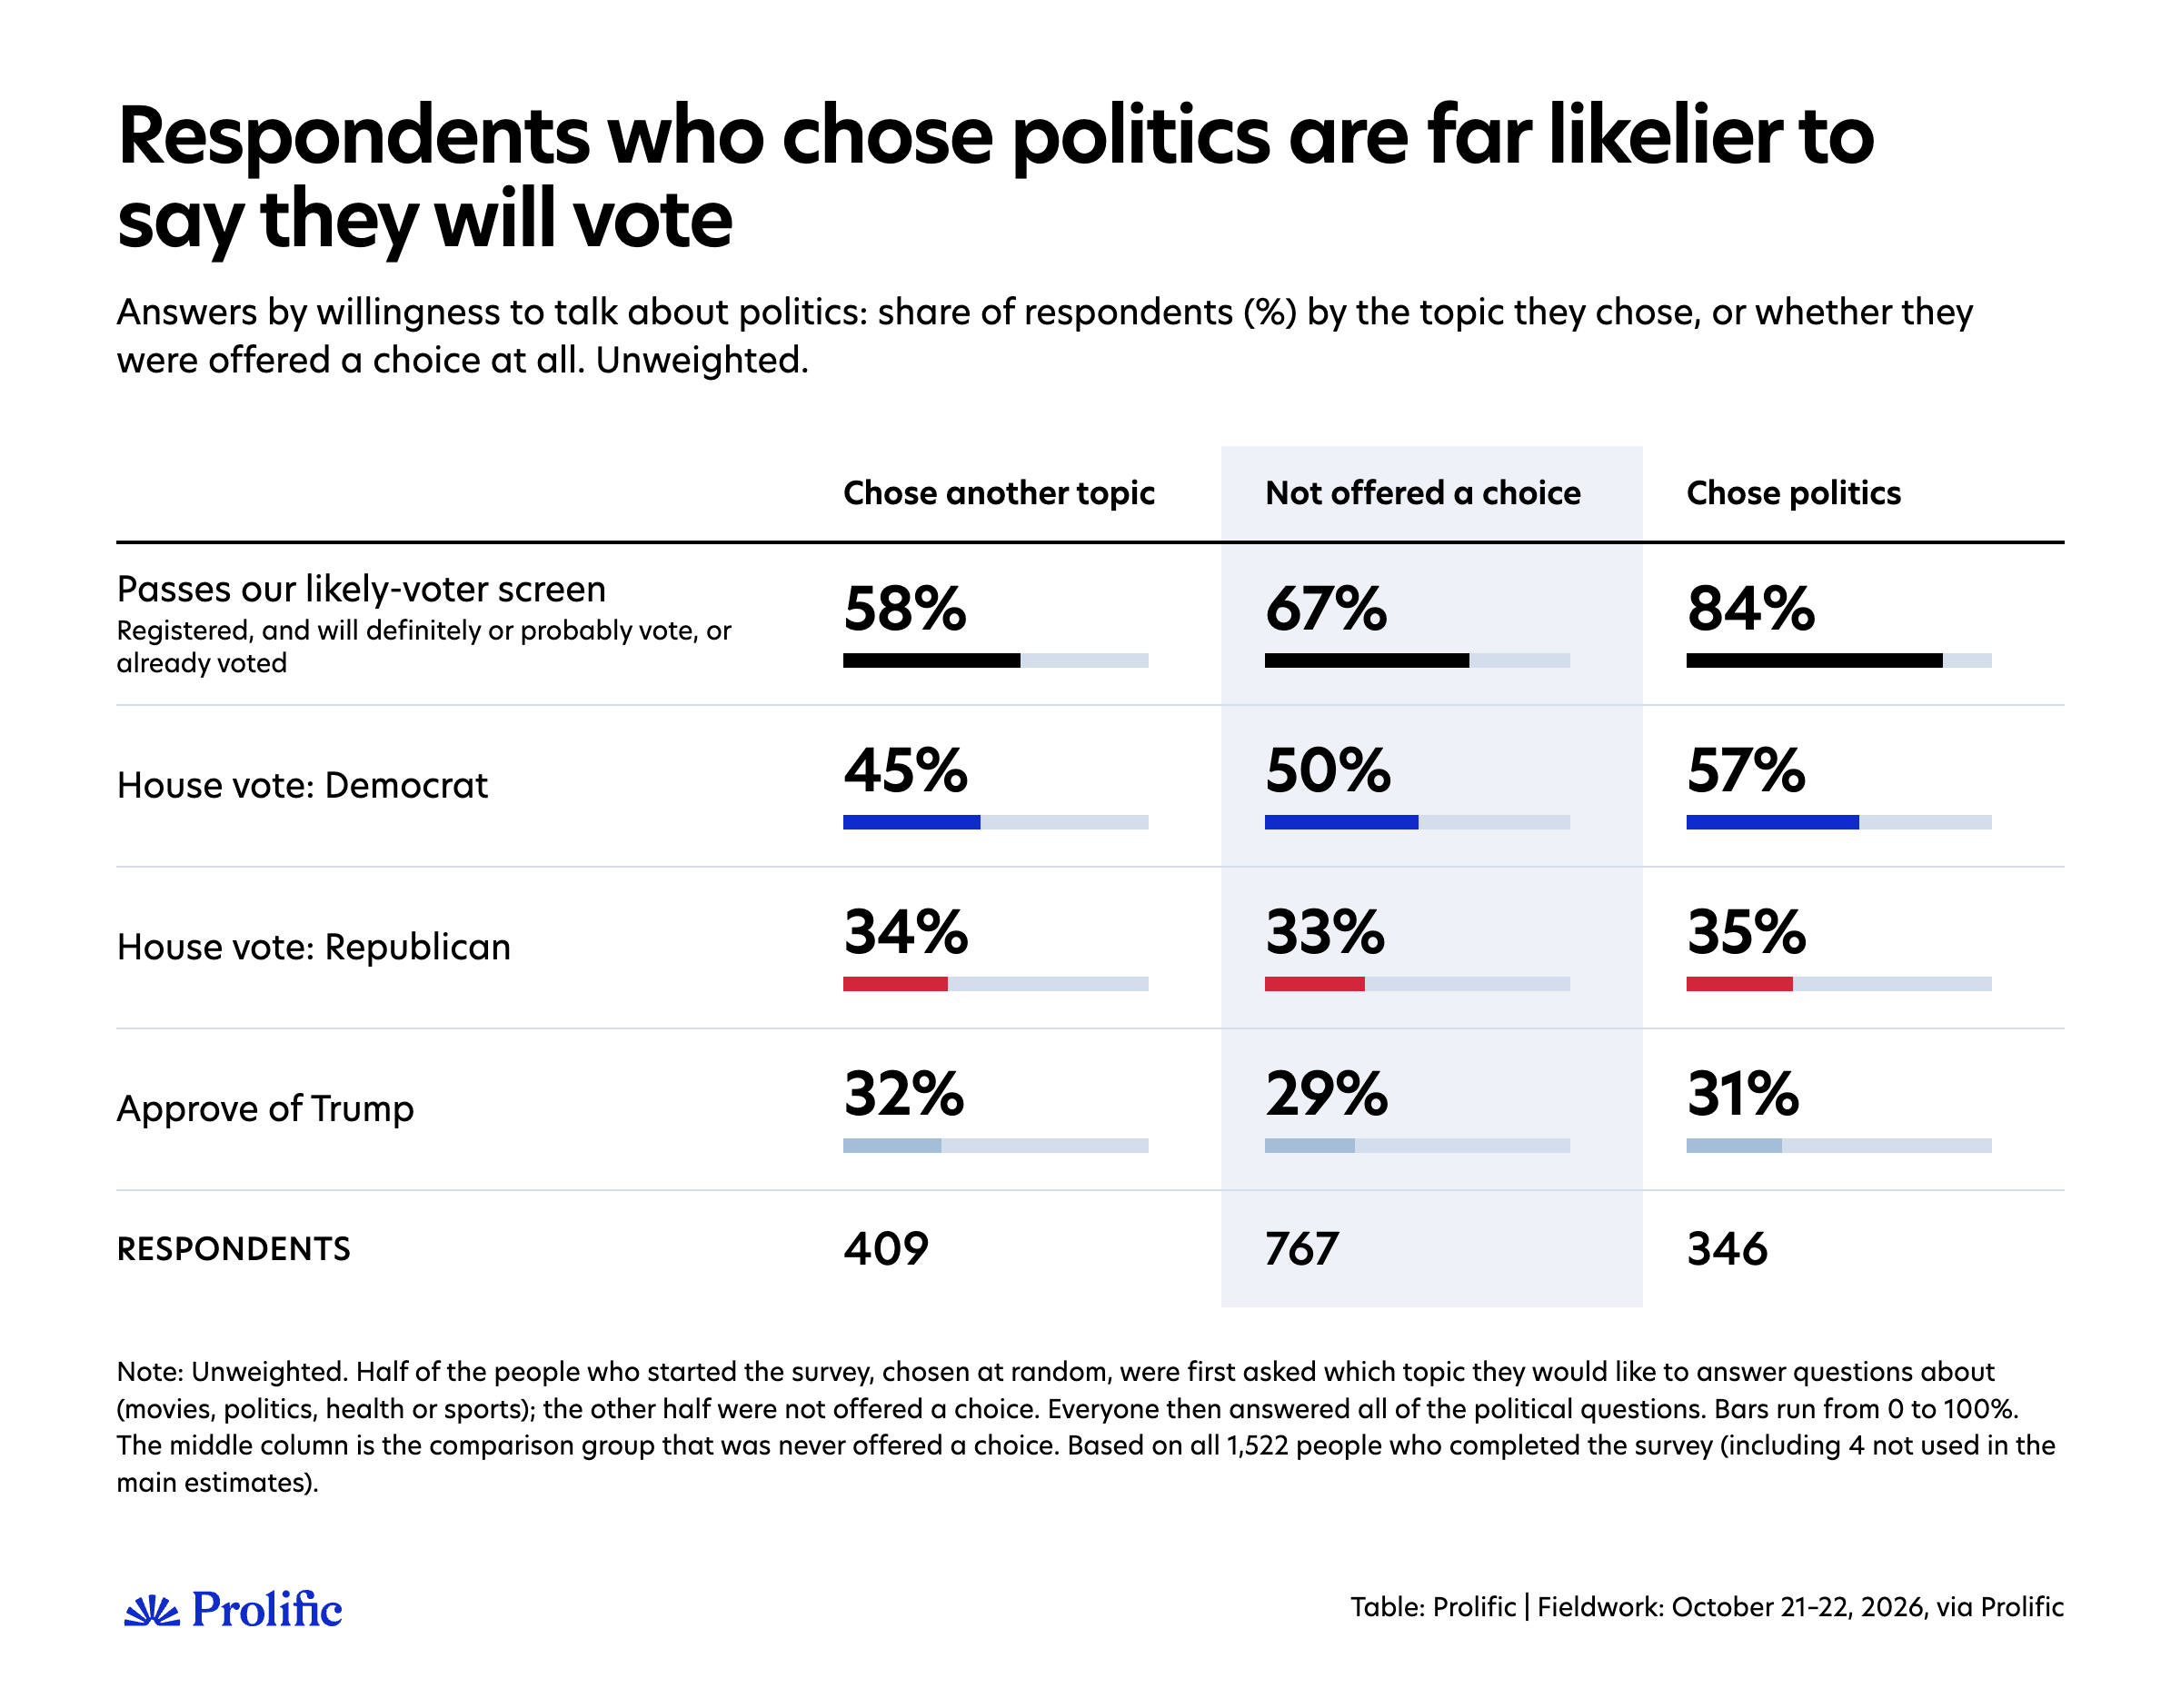
The pattern is clear for turnout. More than eight in ten of those who chose politics pass our likely-voter screen (registered, and say they will definitely or probably vote, or have already voted), against fewer than six in ten of those who chose another topic. Vote choice moves much less. The eager are somewhat more Democratic, mostly because fewer of them are undecided, while Republican support and Trump approval don’t move.
Two statistical models that use the random assignment to separate eagerness from everything else tell the same story: a Heckman selection model and the method Bailey proposes. The link with stated turnout holds even when we compare people of the same demographics, party, and past vote: passing our likely-voter screen makes someone several times more likely to pick politics. For vote choice, the estimates are indistinguishable from zero. And the link between eagerness and stated turnout is no stronger in one party than the other.
So, for now, two takeaways:
We shouldn’t take stated intention at face value. The people who answer political polls are disproportionately the eager ones, who are more likely to say they will vote even compared with people of the same party, past vote, and demographics. So a poll’s respondents can make turnout intentions look higher than they really are, in ways weighting can’t remove. It’s the same worry behind the penalty Times/Siena applies to stated intention.
We find no clear evidence that this tilts the race between the parties. The experiment doesn’t affect our headline numbers either. The full sample looks just like the group that was never offered a choice (68.5% vs 67.1% pass our likely-voter screen; 50.3% vs 50.2% back Democrats).
This is about people who started our survey, and about what they say they’ll do. We’ll go deeper in a separate piece, with more data, more complex analyses, and the actual turnout of these same respondents, whom we’ll re-interview after the election.
Would a more complex method change the answer?
Raking is the workhorse of survey weighting, but it's not the only option. Newer methods match not just each variable but how the variables combine, which in principle corrects imbalances that raking misses. The Times/Siena poll switched this summer to one of them, energy balancing.
We tried it alongside multilevel calibration and kernel balancing (both from Erin Hartman and colleagues), and multilevel regression and poststratification (MRP). Among likely voters, differences are generally small, ranging from a Democratic lead 1.4 points lower with kernel balancing to 1 point higher with multilevel calibration, compared with raking on the same variables.
What are the takeaways?
With this article, we wanted to be more transparent about how we report polling numbers. Instead of presenting one number, we’ve shown the decisions behind it and what each one is worth.
That’s a risk: laying out a range from about 5 to about 15 points can make our work look less certain than a single headline figure would. But the uncertainty is there whether we show it or not. Every pollster has to make decisions, and often different options are completely valid even if they produce different results. I think the field gets better by sharing them: which choices we make, why, and how they turn out once the votes are counted.
The spread of results also tells us something about the race itself, beyond the uncertainty:
The Democratic lead is robust. It survives every combination of choices we tried, including the ones most favorable to Republicans.
The enthusiasm gap is real in our data. The more we trust what people tell us about whether they’ll vote, the bigger the Democratic lead gets. That only happens because Democrats are the more motivated side.
Higher turnout doesn’t rescue Republicans. In both of our turnout models, the extra voters who come in as turnout rises lean Democratic (by about 8 points with stated intention and about 11 without). The question isn’t how many people vote, but whether the voters each party is counting on actually show up.
Much depends on whether Republicans’ slide in party identification is real. Pew’s survey shows the share of Republicans falling from 31% to 28% in a year. If that’s a genuine shift, our preferred numbers hold. If it’s partly noise, a three-year average is the safer benchmark, and the lead is about 2 points smaller.
We’ve made our choices: 2026 party benchmarks with leaners, and a turnout model that uses stated intention but discounts it by how well it predicted turnout in past midterms. That gives a Democratic lead of about 11 points among likely voters (D+10.7), with Democrats at 53% and Republicans at 42%. We could be wrong, and the sections above show how the estimate moves depending on where.
A realistic range, given these choices, runs from about D+7 to about D+14. The low end is what we’d get if stated intention turns out to be worth nothing this year. The high end is what we’d get if we take people’s stated intention entirely at face value. The core of that range is D+9 to D+13, which is where our preferred turnout model lands under each party benchmark.
The Silver Bulletin average has Democrats at 9.1, or 9.6 adjusted for likely voters. In October, polls built on probability samples averaged about D+10, and online opt-in polls about D+7.5. So we sit above the overall average, close to the probability-based polls, and above most opt-in trackers.
Turnout is likely to decide how right we all are. If the enthusiasm gap shows up at the ballot box, the polls that discount what people say about voting, including ours, might have understated Democrats. Taking stated intention at face value, our lead would be 13 to 14 points.
Could we instead be overstating Democrats? There are plausible ways:
Republicans’ drop in party identification turns out to be noise. Weighting to a three-year average would take about 2 points off.
Disaffected Trump voters come home late. Pew finds that a quarter of Trump’s 2024 voters now view the Republican Party unfavorably, and they are both less engaged and less settled. Only half of them back Republican candidates, and a quarter aren’t sure. If they turn out after all and vote Republican, the race tightens. Because we ask undecided respondents which way they lean, few remain undecided in our numbers, so this would show up as people changing their minds rather than undecideds breaking late.
Nonresponse we can’t fix. Republicans who don’t take polls may differ from those who do in ways that weighting on party and past vote can’t fully correct, as in 2020. Our experiment found no sign of this tilting vote choice, but it can only see people who started our survey.
Each of these is possible. None looks large enough in current evidence to wipe out a lead this size, but enough to mean Democrats might not win as big as they expect, or need to control both the House and the Senate.
After the election, we’ll re-interview the same people, see who actually voted and how, and score each choice against the result. That’s the other half of being transparent: showing what we got wrong as well as what we got right.
A few caveats
This is one survey, fielded over two days (October 21–22), of 1,518 US adult citizens. The usual “margin of error” pollsters quote assumes a simple random sample, which ours is not, and it ignores the effect of weighting.
So, following the approach Patrick Sturgis and Jouni Kuha propose for non-probability polls, we estimated our sampling variability by bootstrapping: we repeated our entire estimation, including the weighting and the turnout model, on 500 resampled versions of the data. For our headline numbers, the 95% confidence interval is about ±2 points for each party’s share and about ±4 points for the Democratic lead. Confidence intervals for every estimate are in the downloadable Excel files below. Many of the differences between approaches in this article, such as the weighting method, fall within these intervals.
Our panel is opt-in. Our advanced sampling approach balances it on demographics and past vote before any weighting, but it can’t guarantee that people who join an online panel resemble those who don’t in every way that might matter for this race.
Registration and turnout intention are self-reported until we can check them against what people actually did.
Our demographic targets come from the Census Bureau’s 2024 American Community Survey, the same source our sampling design is built on. It is the largest and most precise source for detailed demographic breakdowns, but it’s nearly two years old. Some pollsters weight instead to the Census Bureau’s more recent March 2026 Current Population Survey, which shows a slightly more educated and less employed population. Using those targets would trim the Democratic lead by 0.3 to 0.7 points (registered voters D+10.3, likely voters D+10.0): small, but in Republicans’ direction. Our party ID targets come from Pew’s NPORS, a high-quality survey with its own error. Our turnout models learn from the 2014, 2018, and 2022 midterms; a different cycle would make them less reliable.
Our turnout model also gives a small probability of voting to respondents who say they are not registered, as validated turnout data suggest some of them vote (it’s a self-reported measure at the end of the day). Counting only registered voters, as Ipsos, Verasight and CBS/YouGov do, gives virtually the same results, including for our headline (D+10.8).
The topic-choice experiment covers only people who started our survey and what they say, not what they do. Also, in this article we show only how people who took part in the survey reacted to this experiment, but we have not modeled whether these results can be extrapolated to everyone invited to participate.
To dig deeper into these figures, you can explore the results by downloading all the toplines, cross-tabulation, and sensitivity tables, including margins of errors, to conduct your own analysis.
You can access the full questionnaire here.
Methodology: Prolific surveyed 1,518 US adult citizens (analyzed) on October 21–22, 2026. Participants were invited using propensity-score sampling: a model of the differences between Prolific's US panel and the adult population (ACS 2024; age, sex, race, education, region, 2024 and 2020 presidential vote) defined 25 groups, each invited in proportion to its population share. Estimates are weighted by raking to age × sex, race × education, region and employment (ACS 2024), household income (4 bands; Pew NPORS 2026), certified 2024 results, 2020 vote, registration (CPS) and party identification (Pew NPORS; versions as stated), with weights trimmed at 5. Turnout models were trained on validated turnout in the 2014, 2018 and 2022 Cooperative Election Study. The topic-choice experiment randomized half of those who started the survey. More details about the methodology in the downloadable tables.