What our midterm poll got right, what it got wrong, and why
Two weeks before the midterms, our poll put Democrats about 11 points ahead among likely voters (D+10.7). We also said that, depending on choices every pollster has to make, the honest range ran from about D+7 to about D+14.
The count isn't finished yet, but Democrats are on course to win the national House vote by about 14 points, or about 13 once we account for seats where only one party was on the ballot. We got the direction right, landed inside our own range, and came closer than the polling averages. But, like almost every pollster this year, we underestimated Democrats: by about 2.5 points on a like-for-like basis.
We promised to show what we got wrong as well as what we got right, and this time we can do better than guess. After the election, we went back to the same 1,518 people we polled in October and asked whether they voted, and how. 1,297 answered.
Because we know what each of them told us in October, and what many told us again a week before Election Day, we can pull apart the reasons for the miss: who turned out, who changed their mind, and who was in our sample in the first place.
Key takeaways
We underestimated Democrats by about 2.5 points, less than most. The polling averages were about 4 points short on the same basis.
The main reason was turnout, the risk we flagged in October. Harris voters who said they would definitely vote did so more often than our turnout model expected, and unenthusiastic Trump voters stayed home more often. Taking people at their word would have landed our estimate less than 1 point from the estimated final result.
It's a repeat of 2018. Tested on the 2018 midterm, the same model was 2.3 points too Republican. This year, 2.5. Giving stated intention more weight than past elections suggest would have cut the miss to under a point (0.7), and would have cost nothing in 2014 or 2022.
Very few voters changed their minds, and those who did leaned Republican. 92.6% of the voters we interviewed three times named the same party every time. Switches between parties were rare and balanced, while October's undecided voters and those who decided in the final week broke Republican.
Our sample and weighting held up. Before weighting, our sample leaned too Democratic, not too Republican. Had we got turnout right, none of the alternative weighting schemes we tested would have done clearly better. And weighting on 2024 vote from respondents' Prolific profiles, rather than on what they remember, saved us almost a point of extra error.
People who take part in polls are different, but they described their own turnout accurately. In our experiment, the most politically keen respondents voted more, and about as much more as they had told us.
What will the final result be?
Before judging how well we did, we need a benchmark. The results aren’t official yet, but we can already say with some confidence where the final result will land, and how best to compare it with pollsters' final numbers.
First, the count so far. On November 16, The Polling Desk had Democrats ahead by 56.2% to 42.3% (D+13.9), with 118.4 million votes counted across all 435 districts.
Second, the votes still to count. About 124 million ballots were cast, and 118.4 million House votes have been counted so far.
Not all of that gap is uncounted votes: in recent midterms, between 94% and 96.5% of ballots included a vote for the House. That implies 116 to 120 million House votes in total, so up to about 1.5 million are still to be counted. Most are in states that count mail ballots for days after Election Day, which also lean Democratic.
We assumed each state's remaining votes split like the votes it has already counted, which moves the margin to D+14.0. If late ballots lean 5 points either way, it stays between D+14.0 and D+14.2.
Third, a caveat that often gets left out when judging polls. A generic-ballot poll asks which party you'd vote for, but in 18 districts this year there was no Democrat or no Republican on the ballot. Some are safe seats left unopposed; others are California races where two candidates from the same party made the runoff. Those districts still count towards the national total, all on one side, and they add 2.7 points to the Democratic margin.
To compare polls and results like for like, we need to account for this. Election analysts do it in two standard ways, and we used both:
Estimate what each district would have looked like with both parties running, from its 2024 presidential result (by district, from The Downballot) plus the swing seen in the 417 contested districts, about 7 points toward Democrats. This gives D+13.2 for the projected final count.
Give the unopposed party 75% of the vote, a long-standing convention in academic studies of House elections (used, for example, in Gelman and King's work). This gives D+13.0.
From here on, we use D+13.2 as the like-for-like result. It's our estimate, not an official number, but with so few votes left to count, it will move very little.
How did we do?
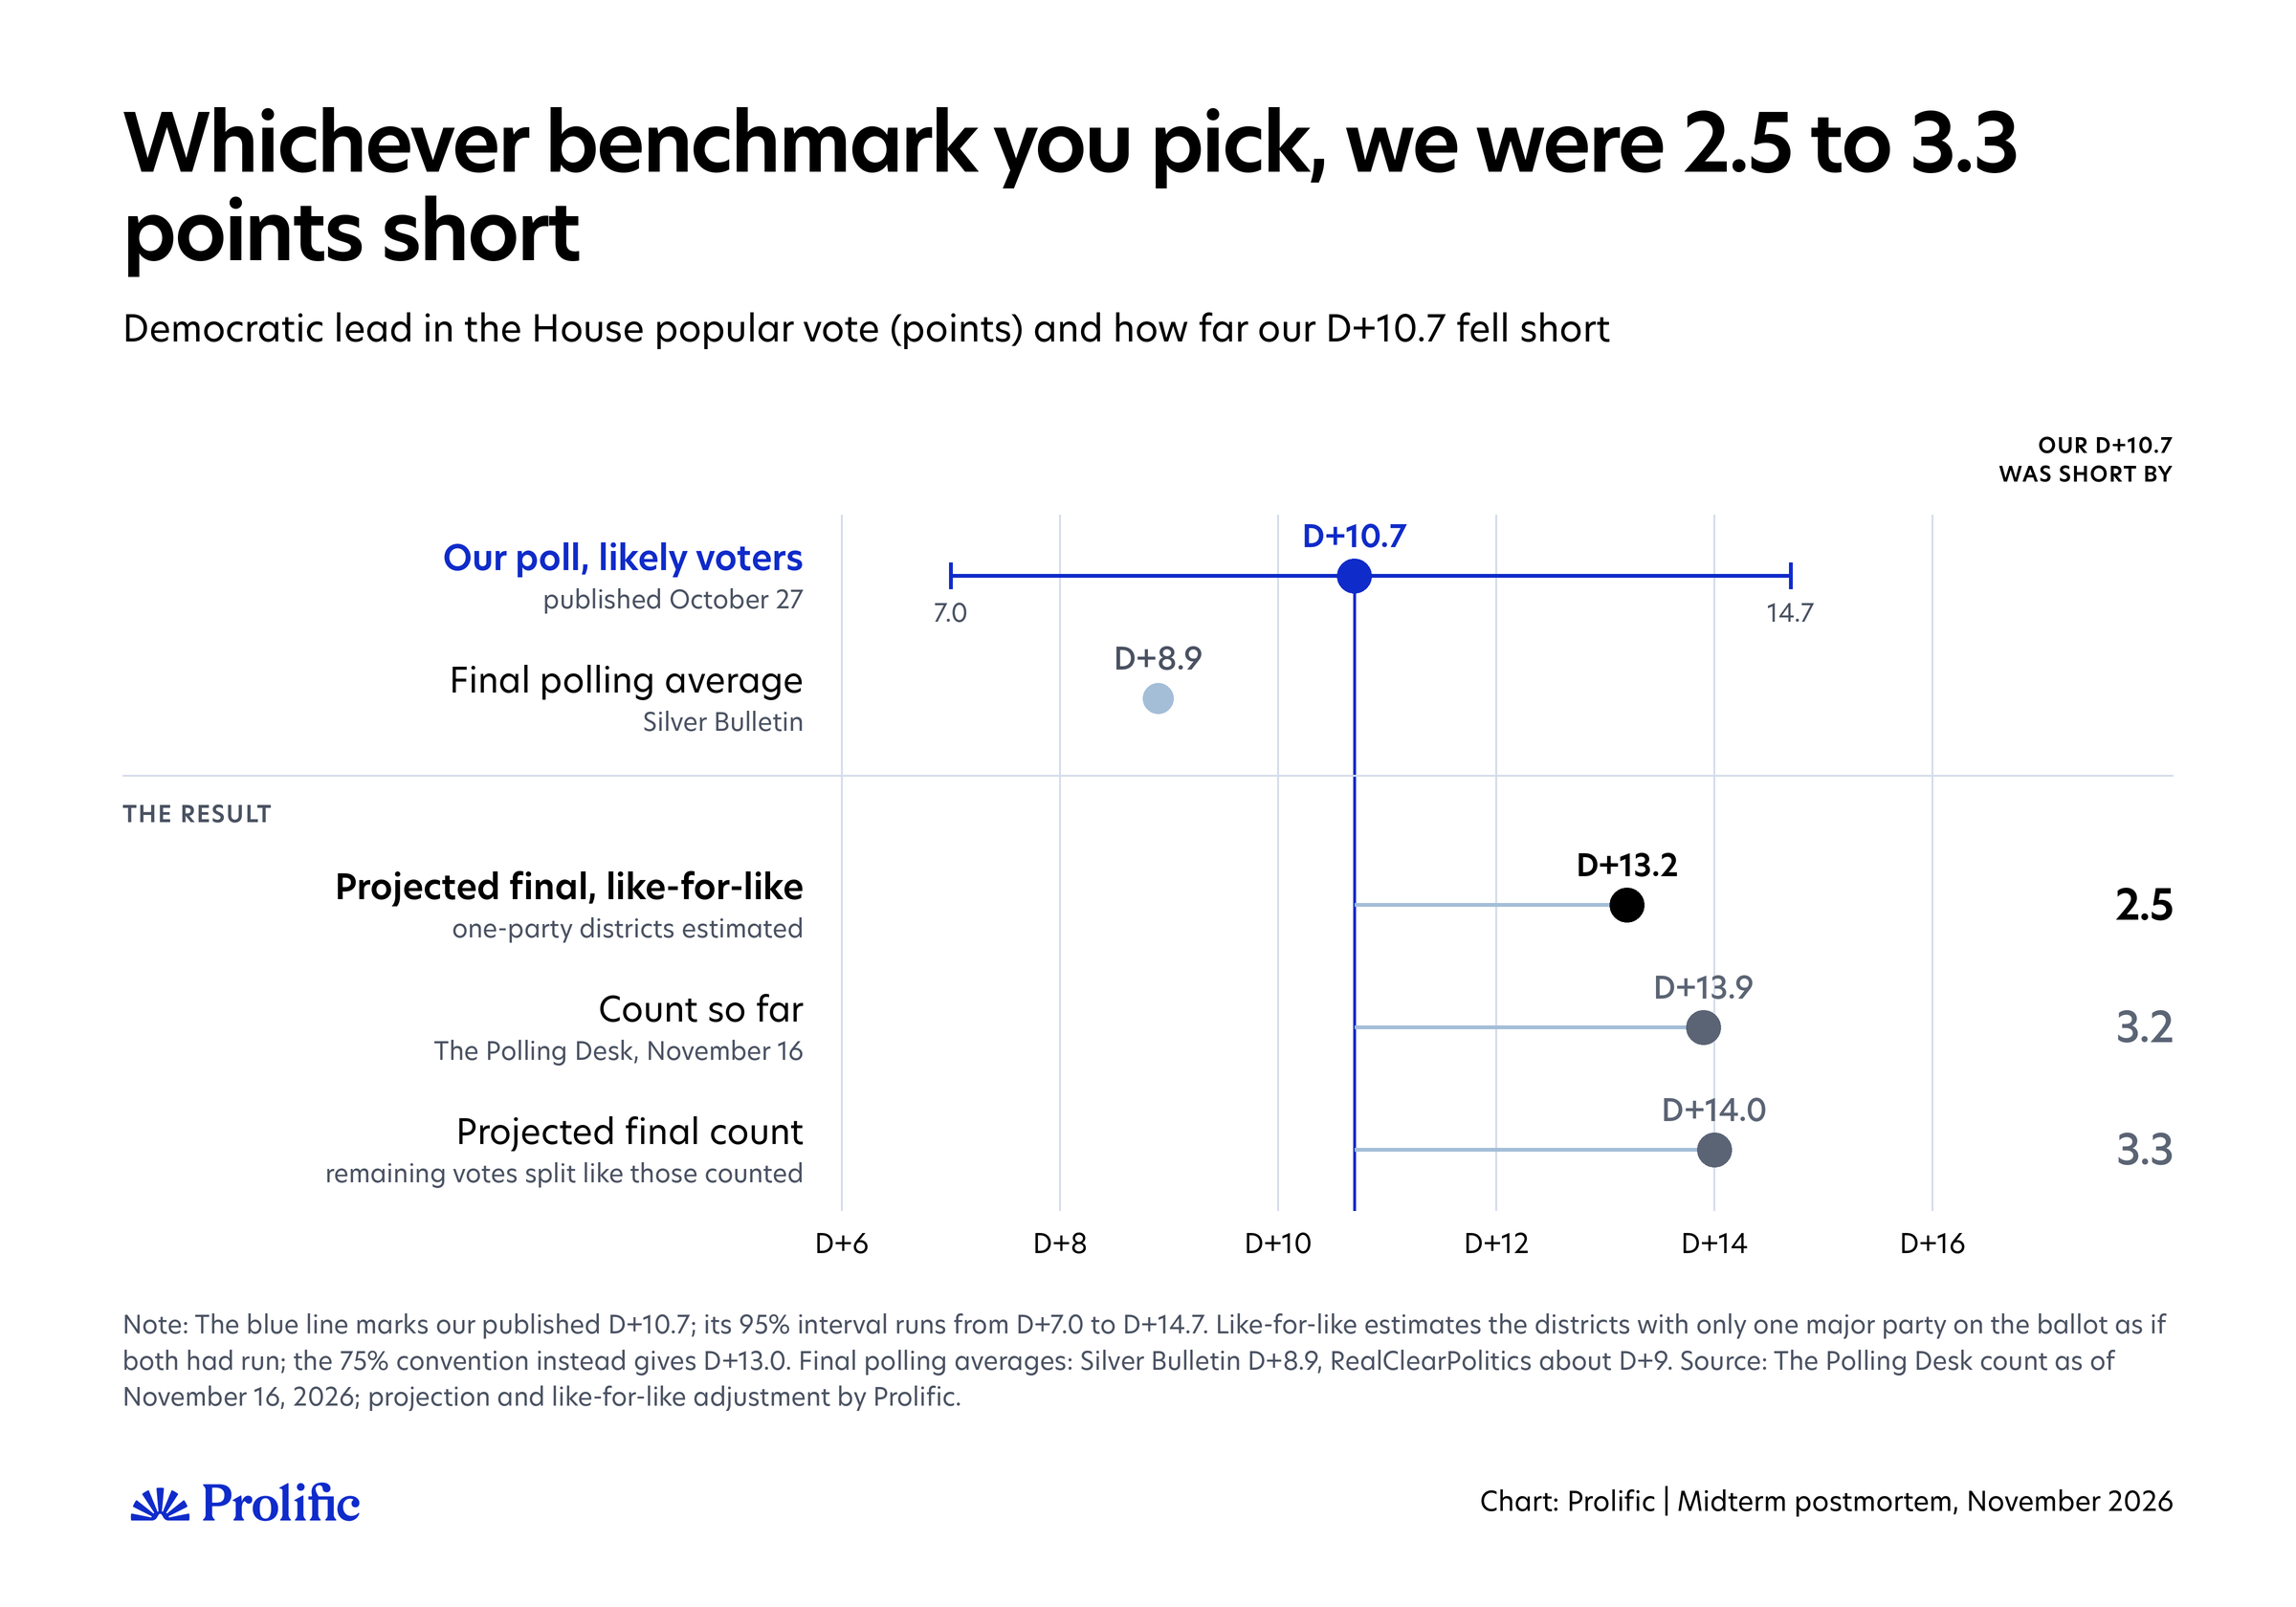
Our published estimate, D+10.7 among likely voters, was 2.5 points short of the like-for-like result. Against the raw count, it was 3.2 points short, and against the projected raw count, 3.3 points short. Whichever benchmark you pick, the result sits inside our 95% interval (D+7.0 to D+14.7) and inside the D+7 to D+14 methodological range we published.
The polling averages missed by more. The final Silver Bulletin average was D+8.9, and RealClearPolitics was nearly D+9. Both were about 4 points short of the like-for-like result.
Some pollsters have described this year's miss as getting Republicans right and Democrats wrong. Comparing each party's share that way is misleading.
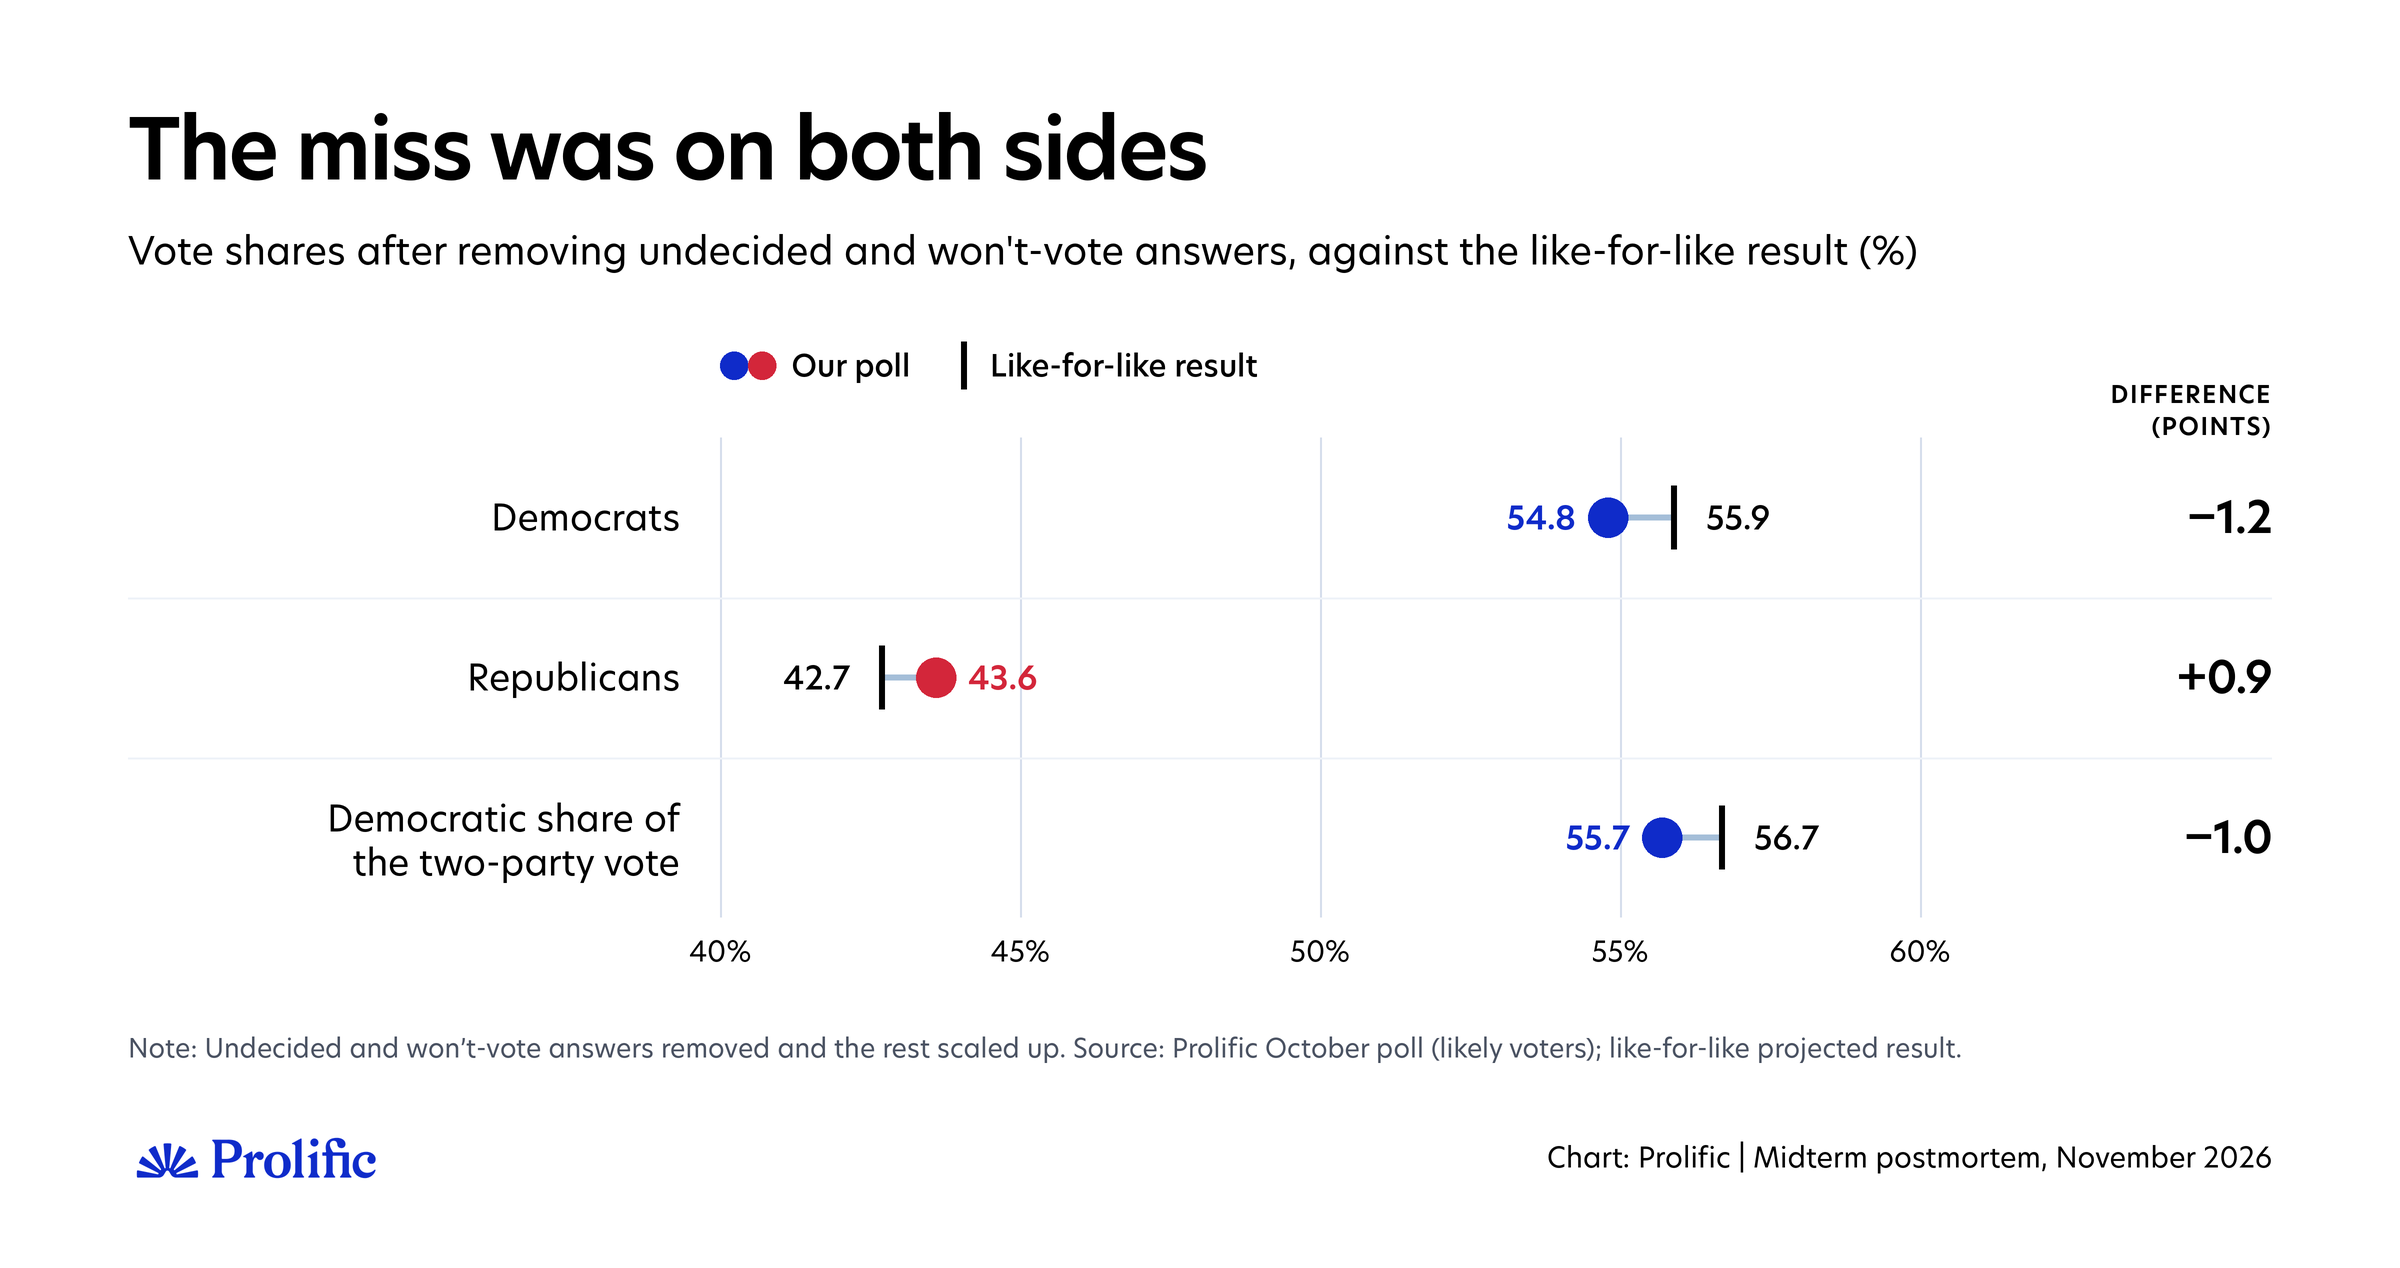
Our published numbers include the 4% who were not sure or said they wouldn't vote, and the official count has no undecided voters. The usual way to compare a poll with a result (Martin, Traugott and Kennedy) is to remove them and scale up the rest. Done that way, we had Democrats at 54.8% and Republicans at 43.6%, against 55.9% and 42.7% like-for-like: 1.2 points too low on Democrats and 0.9 points too high on Republicans. The miss was on both sides.
Turnout: The people who said they would vote did
In October, we said the biggest single choice in our poll was how much to trust people when they said they would vote. Taking them at their word gave D+13 to D+14; ignoring what they said gave about D+7.
We chose a model in between. It was trained on who actually voted in the 2014, 2018, and 2022 midterms, according to official voting records. It combines stated intention with past voting, registration, and demographics, and gives intention only the weight it earned in those elections. That gave D+10.7.
We also said that if this year's enthusiasm gap showed up at the ballot box, polls like ours would understate Democrats. It did, and they did.
We're not the only ones reading it this way. G. Elliott Morris, looking at his own Strength In Numbers/Verasight polls and every public poll in FiftyPlusOne's database, concludes that turnout explains most of the miss: pollsters reached the right people, but their likely-voter models then moved the samples toward Republicans. YouGov's chief scientist, Doug Rivers, told The Washington Post that his data looked "about right on net switching" but overestimated Republican turnout and underestimated turnout among minority and younger voters.
How we know who voted
After the election, we asked all 1,518 people whether they voted. The answer options were designed to make it easy to admit not voting, such as "I usually vote, but didn't this time". Of the 1,297 who answered, 875 said they were sure they voted.
For the 221 who didn't answer, we impute their response. We fit a statistical model (a multinomial logistic regression) on the 1,297 who answered, predicting which of five things each of them did: voted Democratic, voted Republican, voted for another candidate, voted but not in the House race, or didn't vote.
The model uses everything we knew about them before the election:
Their House vote and how likely they said they were to vote in October and, for those who answered it, in our follow-up the week before Election Day
Their 2024 vote from their Prolific profile
Their party identification
Their age, education, race, and sex
We then apply it to the 221. Instead of dropping them, we count each in proportion to their probabilities: say, 60% Democratic, 10% Republican, and 30% non-voter. This assumes that people who didn't answer behave like people who did with the same answers and profile.
Across all 1,518, using our final weights without a turnout model, that implies a turnout of 60% among adult citizens. Actual turnout was about 49.1%, according to the University of Florida Election Lab. So our estimate based on self-reports and imputation is too high. Some of the gap is people overstating, which happens in every post-election survey; some is that people who take polls really do vote more.
We can't check our respondents against voting records yet. So, for the sake of transparency, we show three versions of "actual" turnout throughout the article:
Face value: Everyone who says they voted, voted.
Corrected: We borrow the pattern of over-reporting from the Cooperative Election Study (CES), a large academic survey that matches respondents to official voting records. In the 2014, 2018, and 2022 midterms, 72% of the people who told the CES they voted were confirmed in the records. The rate was higher for people who were certain they would vote (74% to 76%) than for people who said "probably" (47% to 54%), and it differed little by party. We apply that pattern, by stated intention, past vote, registration, demographics and party, to each respondent who said they voted. That gives each a probability that they really did, scaled so turnout across all 1,518 October respondents matches the actual 49%. People who said they didn't vote count as non-voters.
Half-way: The same pattern, scaled so that half of the gap between the 60% our sample reports and the actual 49% is put down to overstatement (54%).
The corrected version assumes that the whole gap between our sample and actual turnout comes from people overstating.
People who take surveys really do vote more, and being interviewed can itself nudge people to vote. In the 2012 American National Election Study, for example, Jackman and Spahn put over-reporting at 6 points of a 13-point overestimate. Our own experiment, below, also shows that keen respondents really do vote more. So the corrected version is an upper bound on the correction, and the truth probably lies somewhere between it and face value.
The correction also borrows from the CES the same kind of information our turnout model uses, stated intention and past vote, so it isn't a fully independent benchmark. That's why we only report a finding about who voted if it also holds at face value.
Did our turnout methods pick the right people?
We start with a simple check of each method against what people did. We take the 1,297 people who answered after the election as they are, with no weights and no estimate for the people who didn't answer. Then we compare what each method predicted in October with what they told us afterward, under the three versions of who voted.
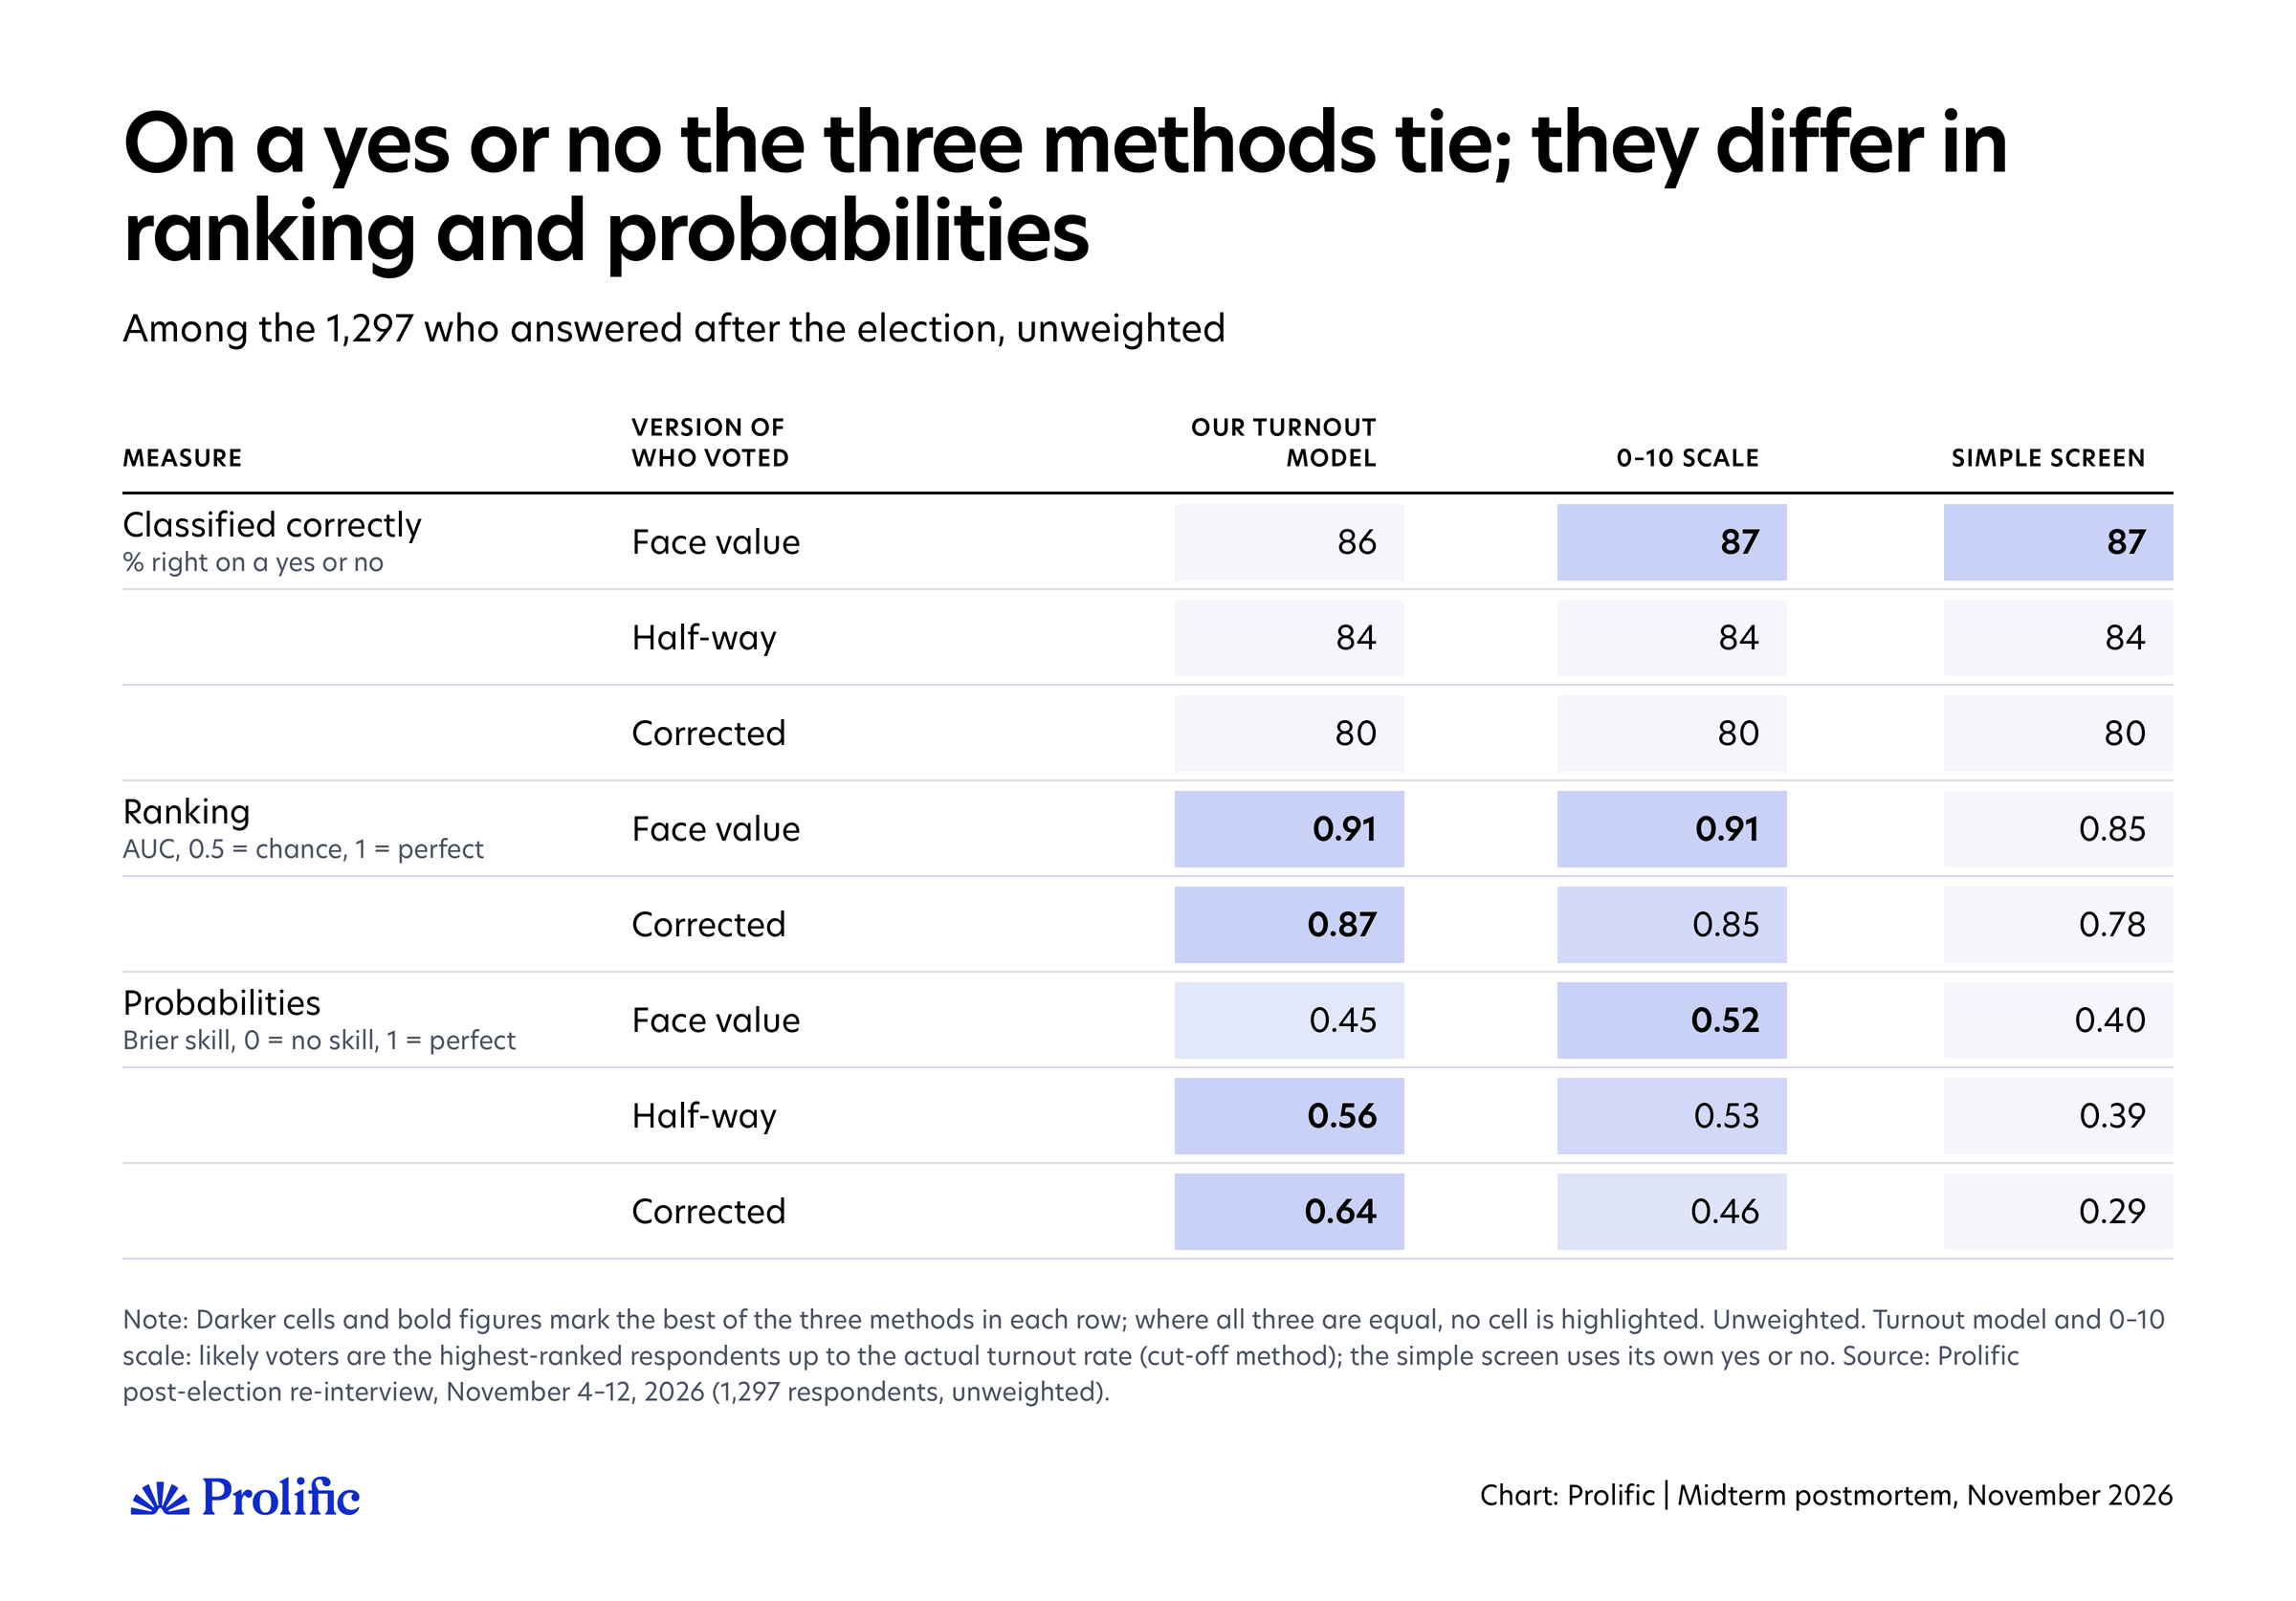
The simple screen gives a yes or no: you count as a likely voter if you are registered and say you will definitely or probably vote, or already have. Our turnout model and the 0–10 likelihood scale give each person a probability instead. To turn those into a yes or no, we use the cut-off method behind Gallup's likely-voter index and Pew Research Center's study of likely-voter models: we count as likely voters the people with the highest probabilities, up to the share of respondents who actually voted. That way, the comparison is about whether a method picked the right people, not about how many it expected.
A yes-or-no answer throws information away, so we also look at the probabilities themselves, using the three standard checks for any prediction model:
Ranking: How well it ranks voters above non-voters (the AUC, where 0.5 is a coin toss and 1 is perfect).
Calibration: Whether its probabilities match how often people actually voted.
Overall score: The Brier score, shown as skill (1 is perfect, 0 is no better than giving everyone the same probability).
On a yes-or-no basis, the three methods are indistinguishable. Under each version of who voted, they classify the same share of people correctly, from 87% taking people at their word to 80% with the full correction.
They differ in how they rank people and how good their probabilities are. The screen is the weakest on both: it ranks voters above non-voters less well (an AUC of 0.85 against 0.91 for the other two at face value), and its yes-or-no format can't express doubt. Between the model and the 0–10 scale, the verdict depends on over-reporting. Taking people's word for it, the 0–10 scale scores better (Brier skill 0.52 against 0.45). Once we allow for half or more of the gap being overstatement, the model wins (0.56 against 0.53, and 0.64 against 0.46).
The two sets of probabilities fail in opposite ways. The 0–10 scale is overconfident. Half our respondents put themselves at 10 out of 10, but 83% to 98% of them voted, depending on the version; among people who put themselves at around 4 out of 10, only a quarter to a third did.
Our model is too cautious. Its likeliest voters, whom it gave 83% to 86%, voted at 89% to 98%. It was also set for turnout among all adults, so it expected fewer of these respondents to vote (56%) than actually did (57% to 67%), as you would expect from people who take polls.
So, once we allow for over-reporting, the model was the best of the three at sorting individuals, and it was never worse at ranking them. But knowing more about each person isn't the same as getting the electorate right. For a poll, what matters is whose turnout each method got wrong.
Whose turnout did we get wrong?
We split the 1,297 respondents into groups, such as Harris voters, Trump voters, or people who said they would definitely vote. For each group, we compare the share who actually voted with the share the method expected to vote.
One adjustment comes first. Our model was set to expect 47% turnout among all adults, but between 57% and 67% of people who answered after the election voted, depending on the version. Left as it is, the model would appear wrong about almost every group simply because it expected too few voters overall. So we shift everyone's probability up by the same amount (on the odds scale) until each method expects the right total. That leaves its ranking of people unchanged, so what remains is whether it expected the right people.
As before, we use no weights, show all three versions of who voted, and treat a pattern as real only if it holds under all three. The charts below show every result.
Where our model went wrong
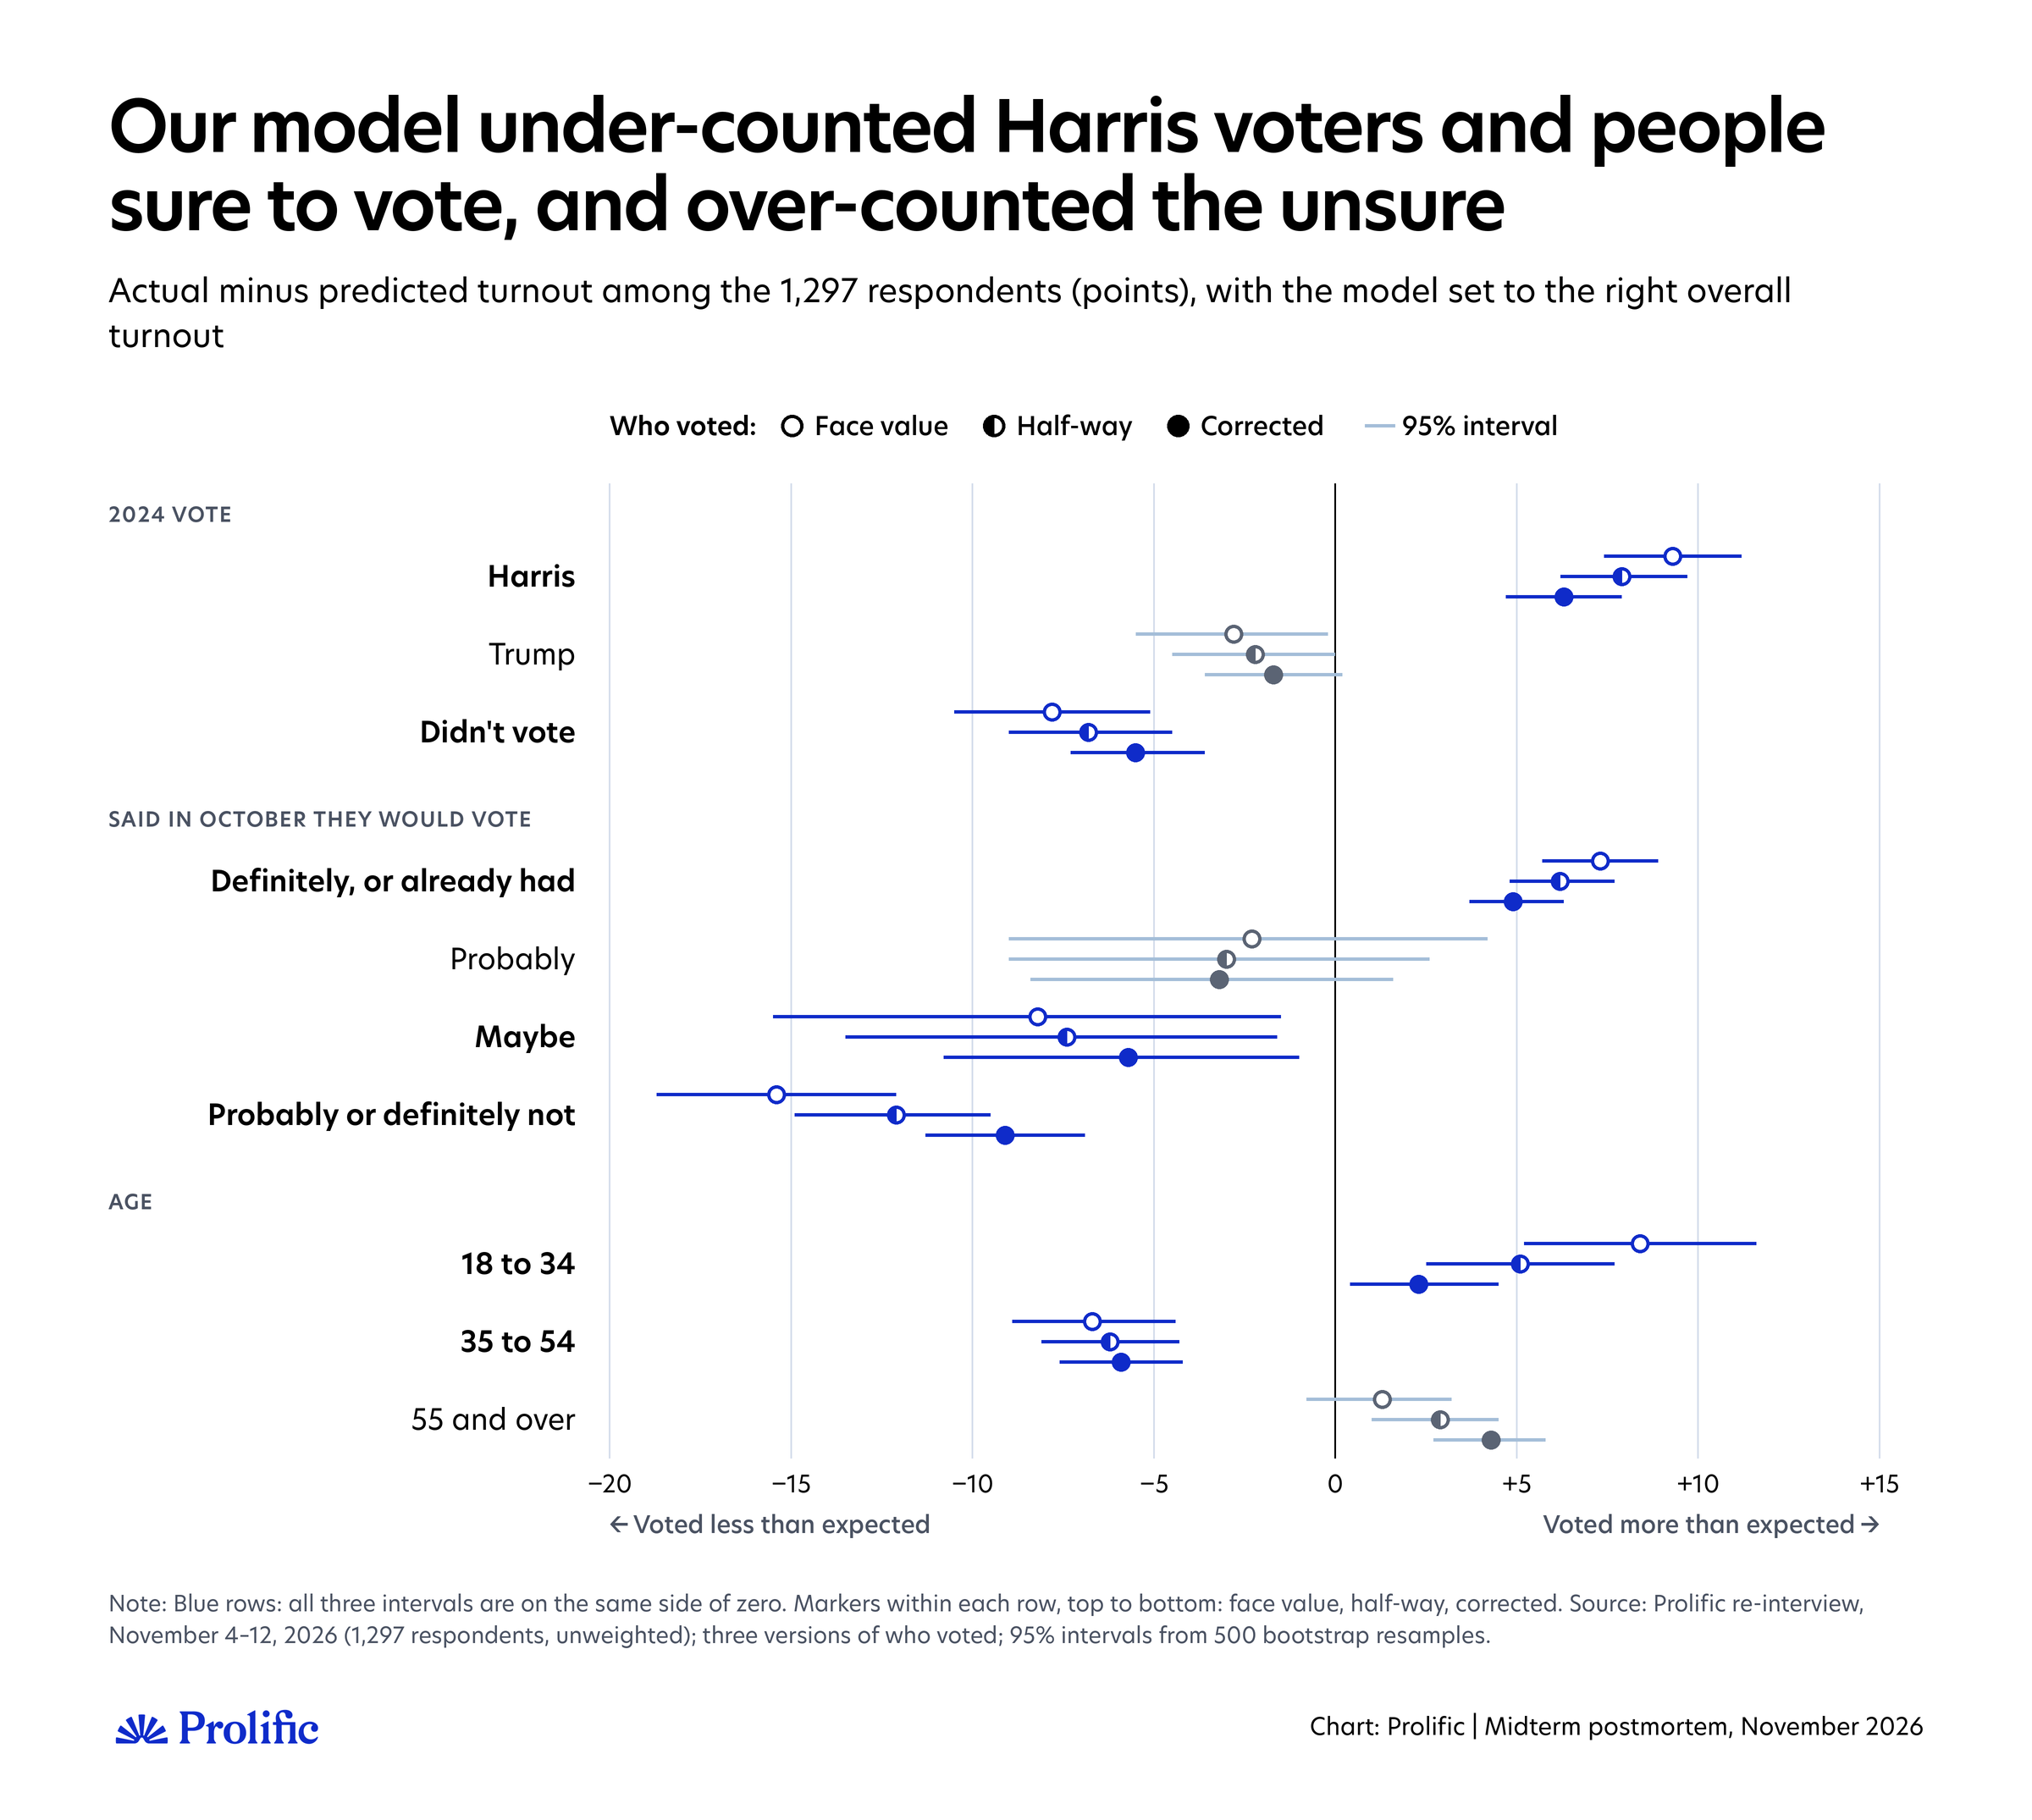
Our model's mistakes leaned Republican. Among the 1,297 respondents, the electorate it implied gave Democrats a lead 3 to 5 points smaller than the lead among the people who actually voted (see the last chart in this section). The chart below shows why.
The 2024 vote
Harris voters turned out 6 to 9 points more than the model expected, Trump voters 2 to 3 points less, and people who didn't vote in 2024 6 to 8 points less. In other words, Harris voters turned out at about 1.2 times the rate of Trump voters; the model expected 1.06 to 1.08 times.
Enthusiasm
People who said in October that they would definitely vote, or already had, turned out 5 to 7 points more than the model expected. People who said they probably or definitely would not turned out 9 to 15 points less.
Harris voters were more often in the first group, so this alone tilted the model toward Republicans. The pattern held within each party too: Harris voters who were sure to vote beat the model by 6 to 9 points; Trump voters who were sure by 3 to 5; and Trump voters who were less sure fell short by 10 to 15.
Age
The model undercounted 18- to 34-year-olds by 2 to 8 points, depending on the version, and overcounted 35- to 54-year-olds by 6 to 7.
Why it went wrong
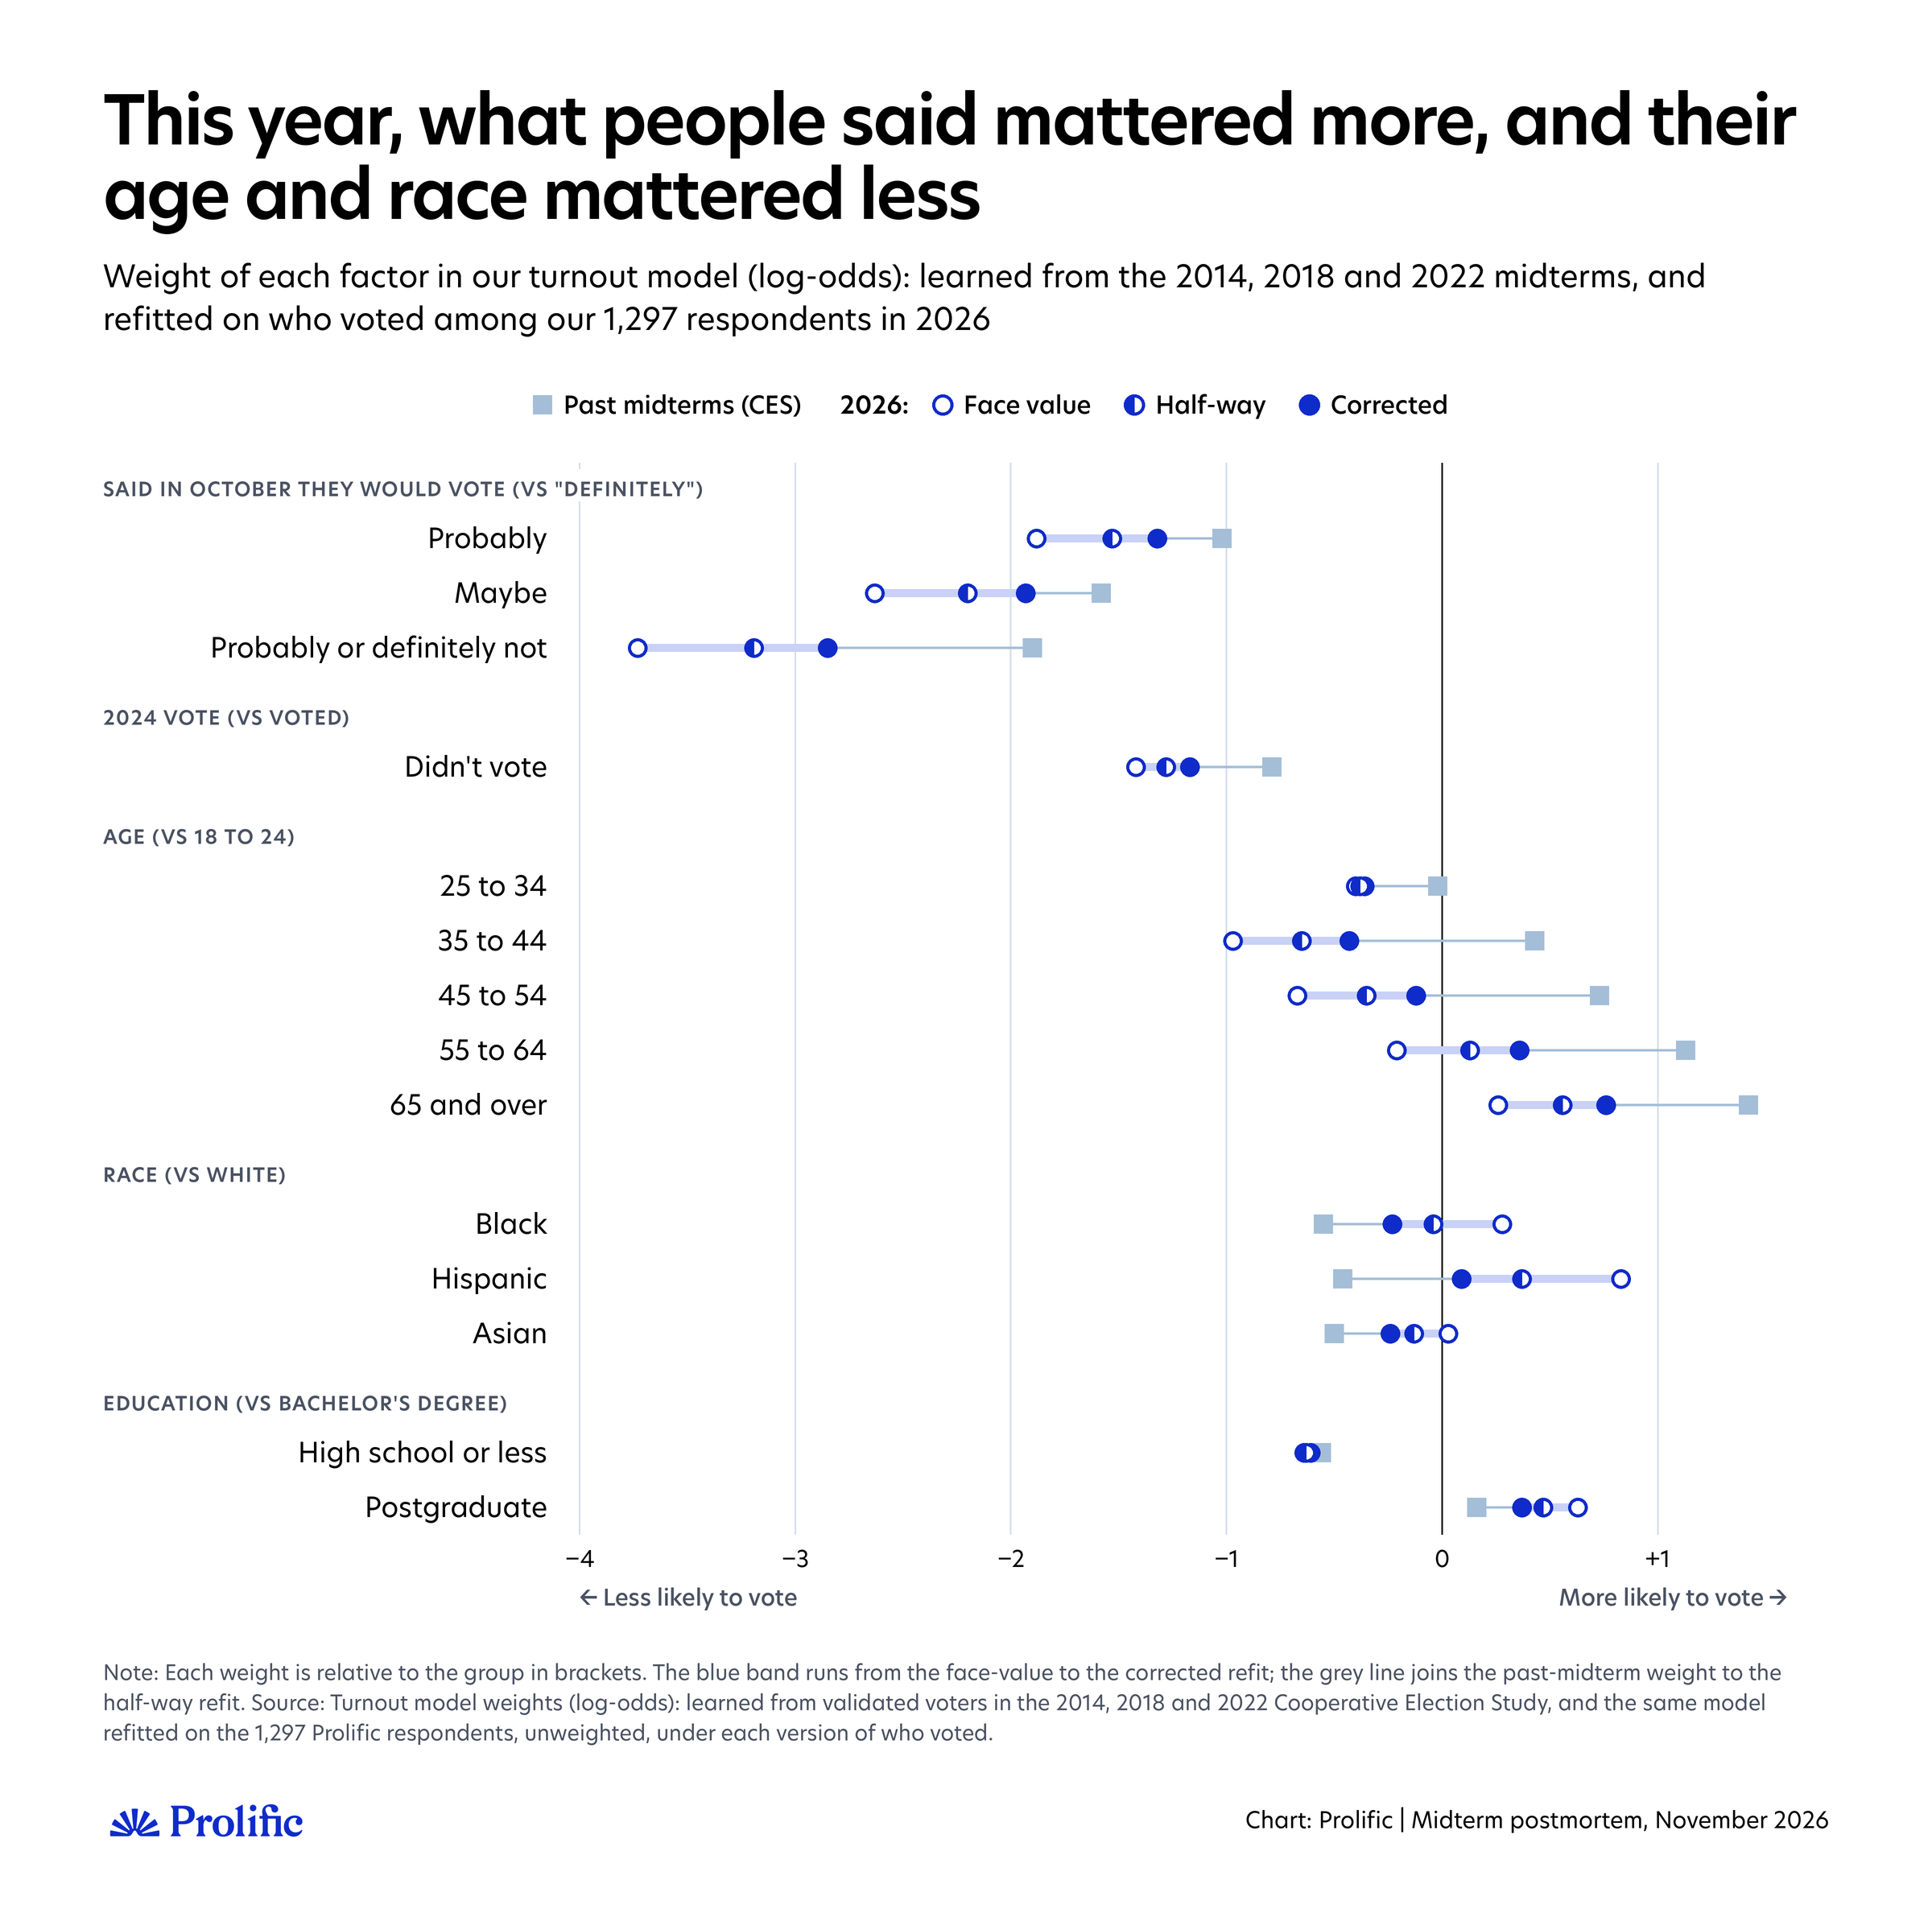
The model learned how much each factor counts from the 2014, 2018, and 2022 midterms. To see why the model went wrong, we let it learn the weights again, this time from who voted in 2026 among our respondents, under each of the three versions. If people had behaved as they did in past midterms, the weights would come out about the same. They didn't.
Three things changed:
What people told us counted for more. The drop in turnout between people who said they would definitely vote and people who said they probably or definitely wouldn't was one and a half to two times as large as in past midterms. Not having voted in 2024 also weighed more against people.
Age counted for much less. In past midterms, people aged 65 and over were far more likely to vote than those under 25; this year, that gap shrank by half or more. People aged 35 to 54 went from voting more than the youngest to voting less.
The race gap shrank. The lower turnout among Black, Hispanic, and Asian people that the model had learned from past midterms shrank or disappeared.
Education counted about as before.
In short, the model leaned on who people were, in a year when what they said mattered more. That's why its mistakes lined up with party: the people most certain to vote were disproportionately Harris voters, and the formula discounted their certainty in favor of a demographic pattern that no longer held. These weights come from our respondents' own reports, not voting records, so they carry real uncertainty. But the direction is the same under every version.
This fits part of the explanation others have offered, but not all of it. Quantus Insights' Jason Corley put it as "a likely-voter screen built on past turnout can't see a surge electorate", and Morris argues that models leaning on vote history threw out new voters, who leaned heavily Democratic. Among our respondents, though, people who hadn't voted in 2024 turned out less than our model expected, not more, and the refitted model penalizes not having voted in 2024 more than ours did.
Our miss came from elsewhere: too little weight on what people said, and age and race patterns carried over from past midterms that no longer held. That's closer to Rivers' description of YouGov's miss (too many Republicans, too few young and minority voters) than to a story about new voters.
The screen and the 0–10 scale
The two methods that take people more at their word also got a lot wrong. They just got it wrong in different ways.
The simple screen's errors were large. It counted everyone who said they would probably vote as a voter, though only half to two-thirds of them voted, and nobody who said maybe, though a quarter to a third of them did. Once we allow for over-reporting, it also counted too many young people and too few people aged 55 and over.
But across Harris voters, Trump voters, and 2024 non-voters, its errors were small and went no consistent way. The screen didn't pick the right people. It picked the wrong people in roughly equal numbers on both sides, so its mistakes canceled out in the margin. Nothing in its design guarantees that and, as we show below, in each of the last three midterms its mistakes did not cancel.
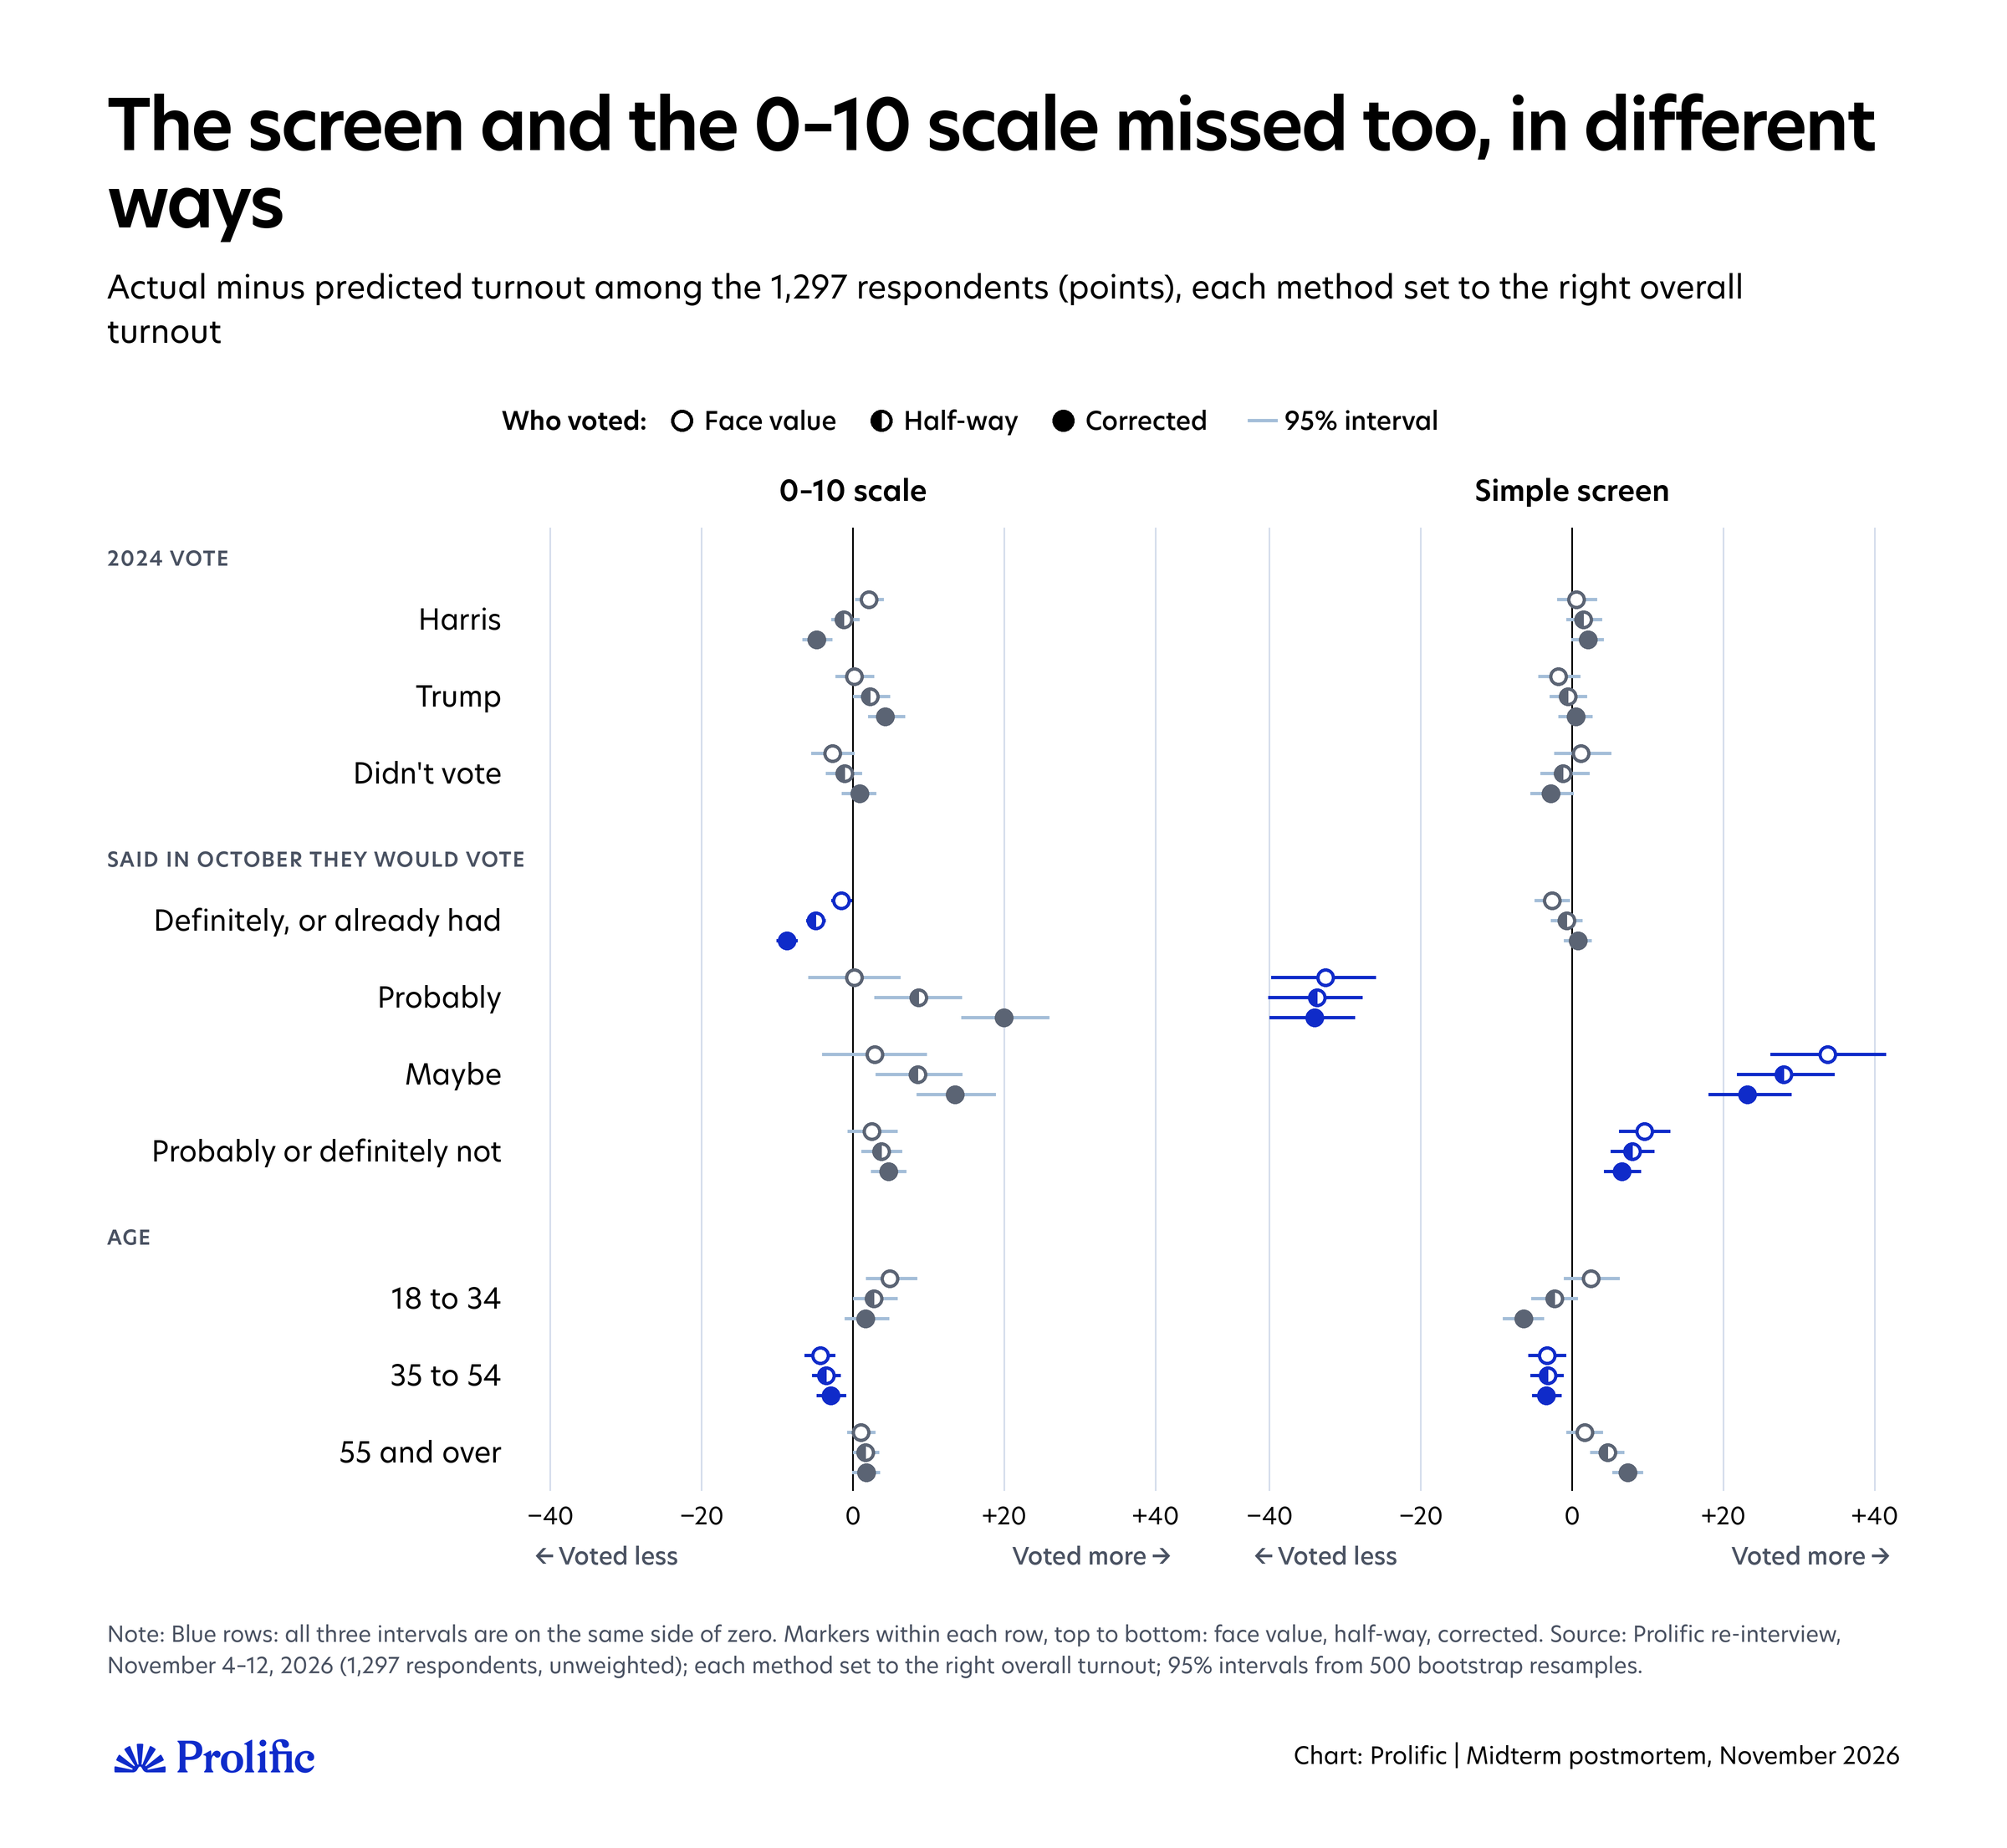
The 0–10 scale has the opposite problem: it's overconfident. Taking people's word that they voted, its errors roughly balance. But once we allow for over-reporting, it overcounts people who said they were sure to vote and undercounts the unsure, by up to 20 points among people who said "probably". Because the sure were disproportionately Harris voters, it expected too many Harris voters to vote and too few Trump voters.
What we learned
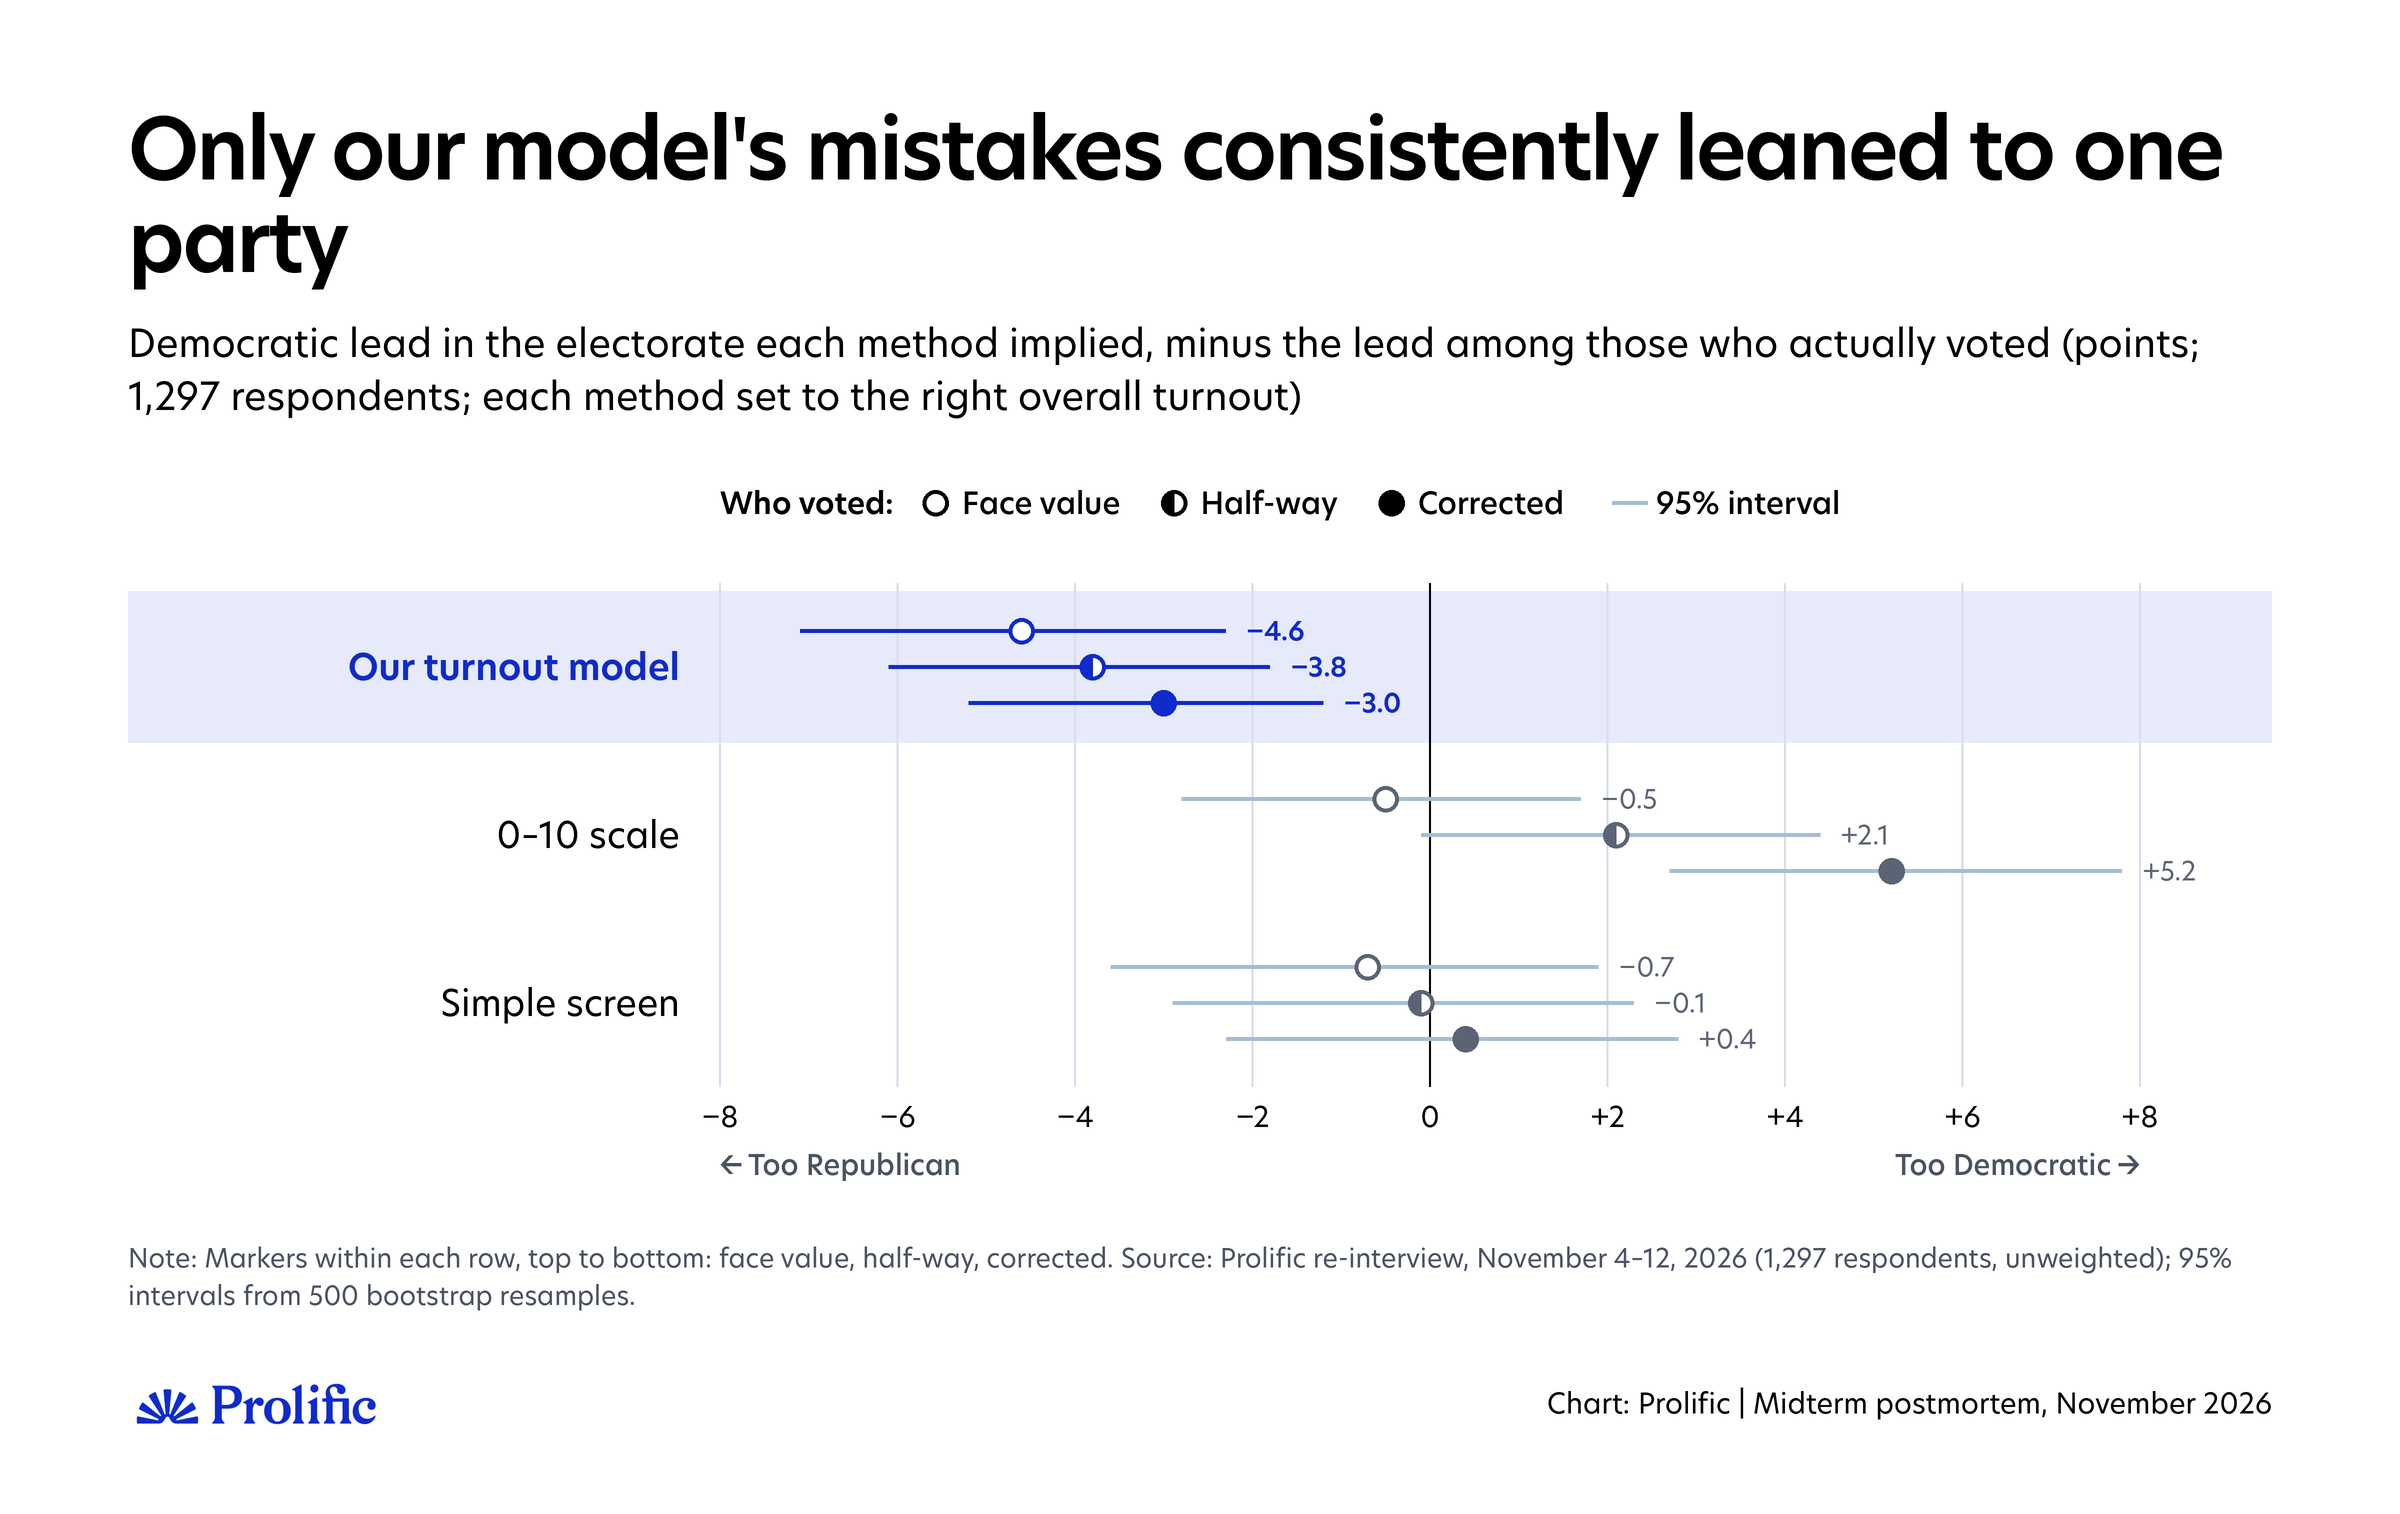
Side by side, the three methods tell one story:
All three made similar mistakes about individuals. On a yes-or-no basis, each classified 80% to 87% of people correctly, depending on the version of who voted.
Only our model's mistakes leaned consistently to one party. The electorate it implied was 3 to 5 points too Republican under every version, because it discounted stated intention in a year when intention split by party.
The screen landed on the right balance because its large errors happened to cancel, not because it picked the right people.
The 0–10 scale leaned the other way once we allow for over-reporting, by 2 to 5 points, because it trusted its keenest respondents too much.
The lesson is about how much weight stated intention gets, not about dropping the model. A model that gave intention more weight when an enthusiasm gap shows up would keep the model's precision and lose most of its bias. We test that below.
What electorate did each method imply?
To see the whole electorate each method implied, we need everyone. So here we use all 1,518 October respondents with their October weights, imputing what the 221 who didn't answer did, as described above. We then compare the electorate each method expected with the electorate that turned up under each of the three versions of who voted.
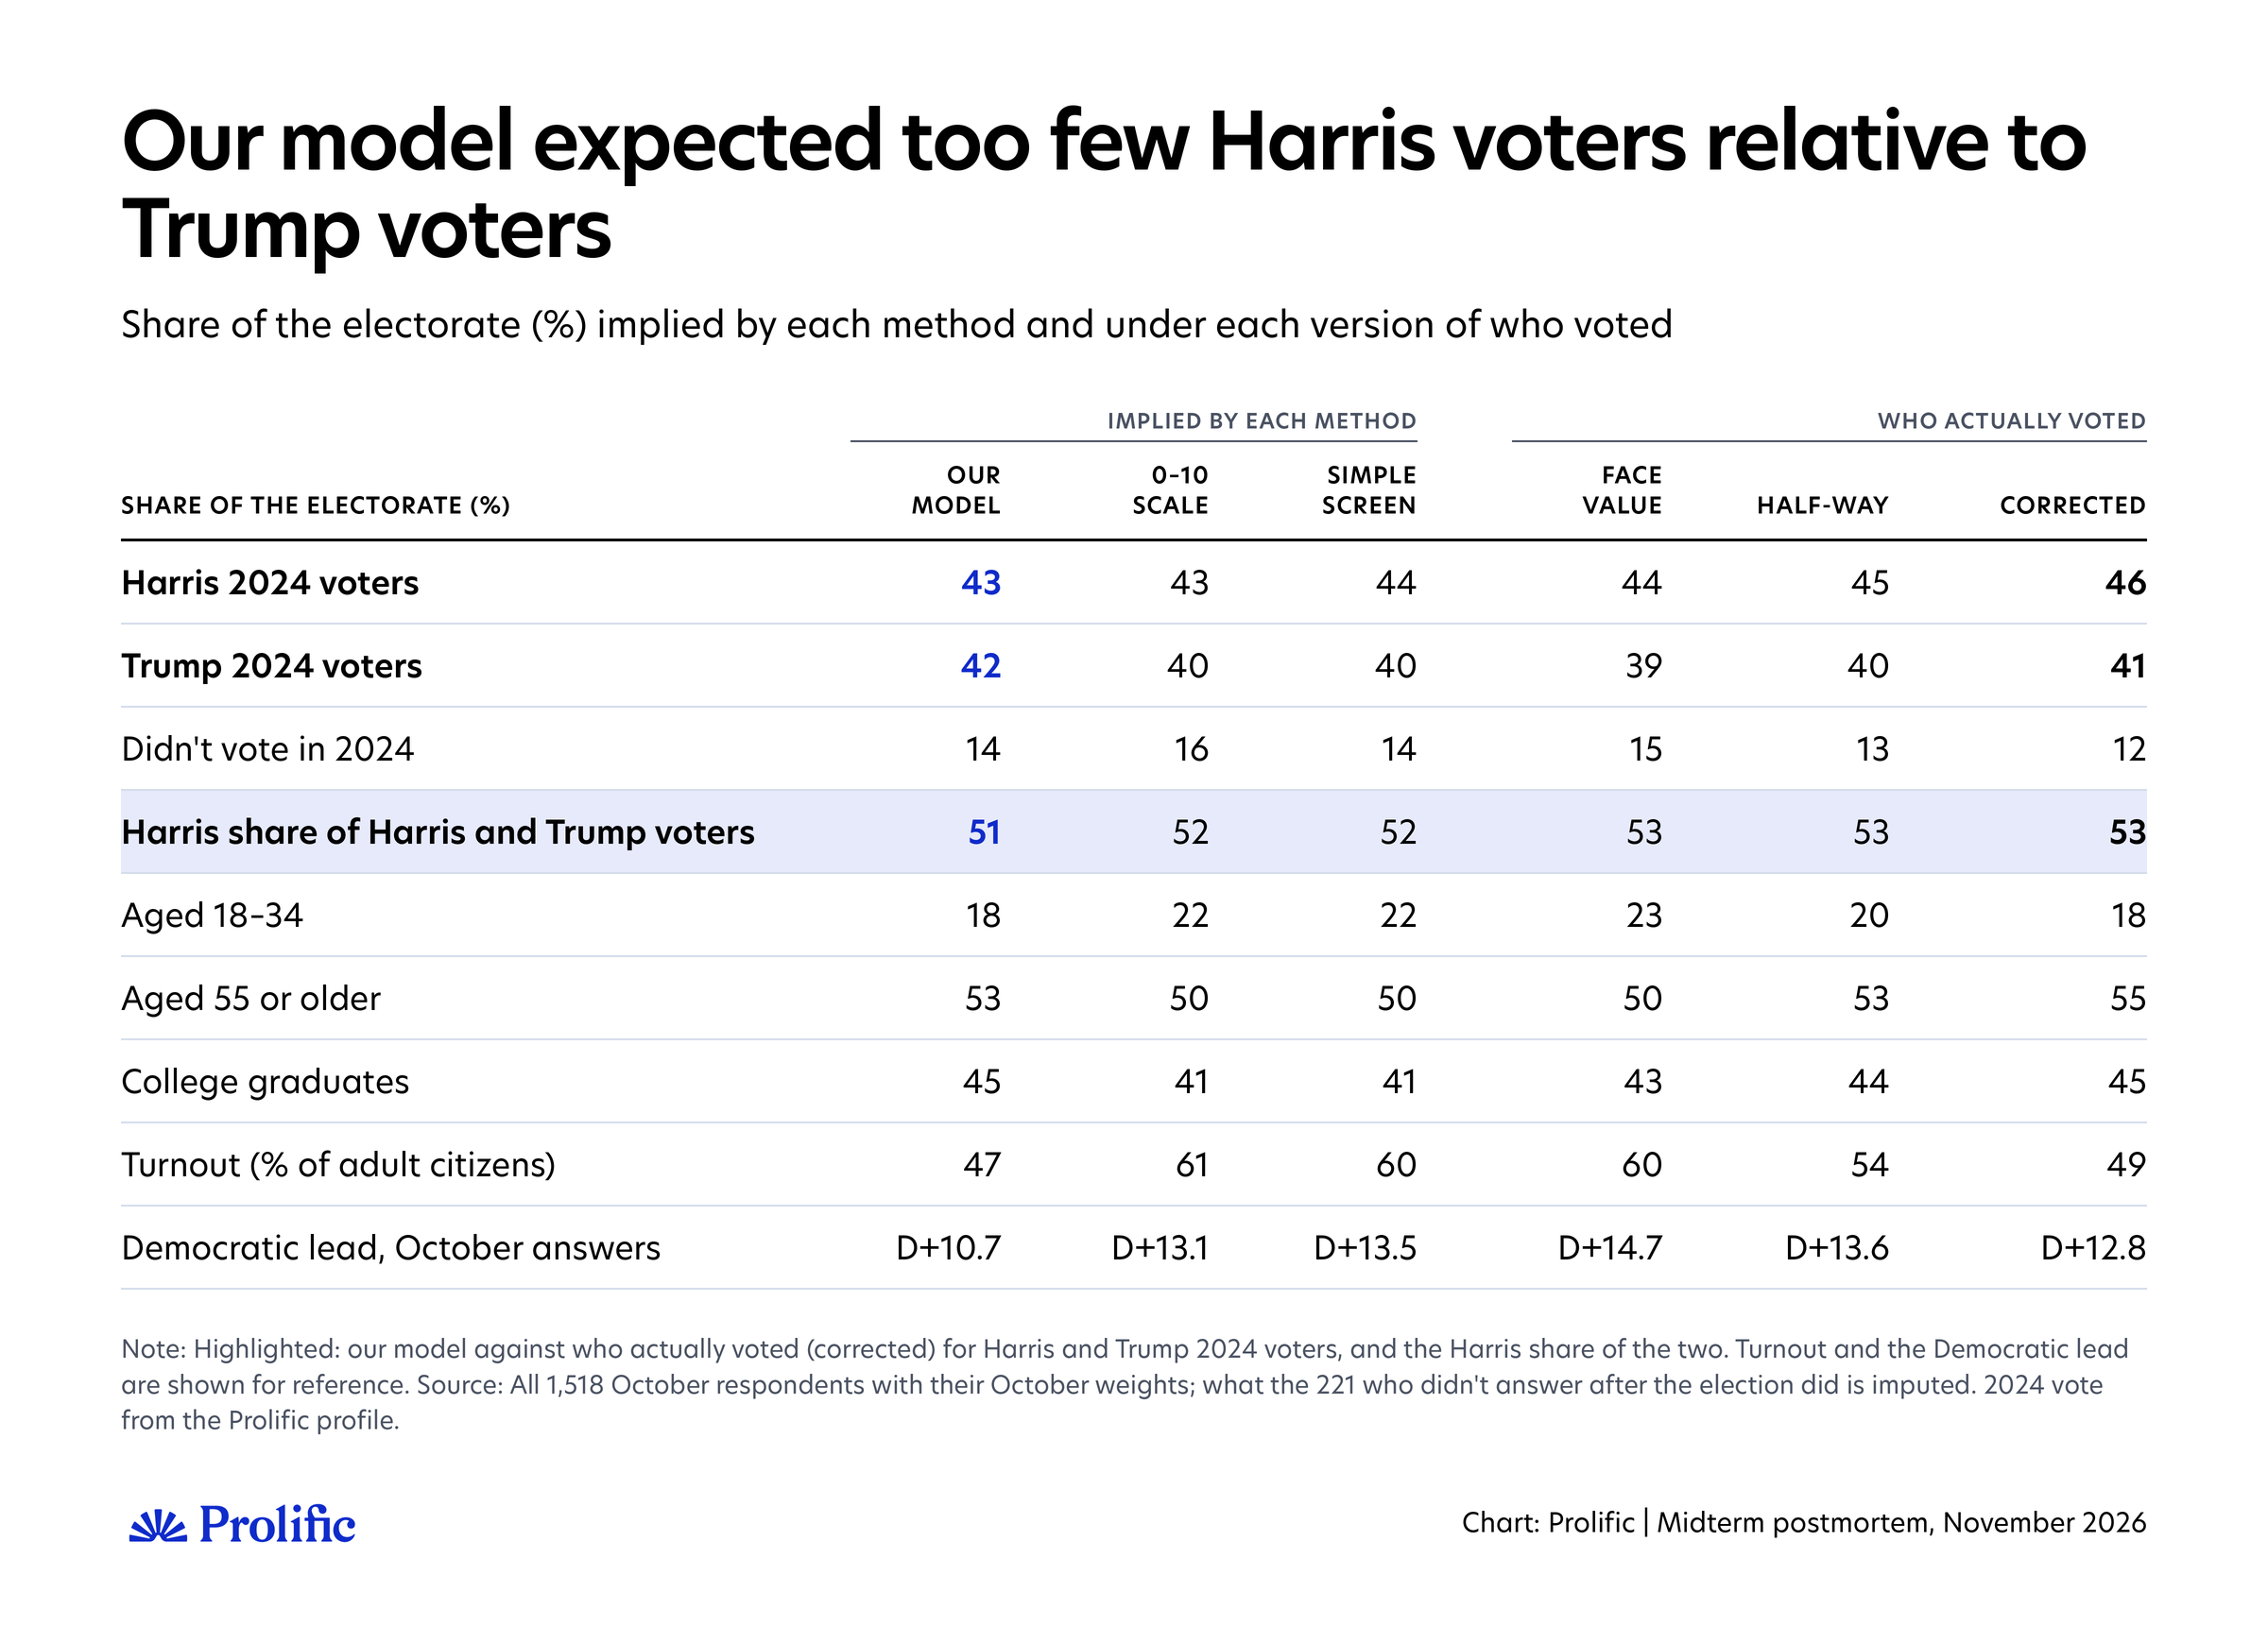
Our model expected an electorate in which Harris voters outnumbered Trump voters by about 1 point (43% to 42%). Whatever we assume about over-reporting, the electorate that turned up had a gap of about 5 points: 44% to 39% taking people at their word, 45% to 40% half-way, and 46% to 41% with the full correction. Put another way, Harris voters made up 53% of all 2024 Harris and Trump voters in the electorate under every version, against 51% in the electorate our model expected.
Morris measures the same thing in a way that's easy to picture. In two-party terms, all adults in our weighted sample lean Trump by 1.5 points on their 2024 vote, as the country did. Among the Harris and Trump voters who turned out, Harris led by 5.6 to 6.2 points, depending on the version. Turnout moved the electorate about 7 points toward Democrats. The electorate our model expected moved only about 3 points, to Harris +1.4.
Morris finds almost the same in his own poll: turnout moved the electorate about 6.5 points, and his model about 3. Put as turnout rates, his likely-voter model expected Harris voters to turn out at 1.06 times the rate of Trump voters, and so did ours, against about 1.15 to 1.17 in reality.
On everything else, the versions disagree, and the model was not clearly wrong. The more of the reported turnout we treat as overstatement, the older the electorate looks and the fewer 2024 non-voters it includes: from 50% to 55% aged 55 or over, and from 15% to 12% who didn't vote in 2024. Our model expected 53% and 14%, inside that range. Its error was the balance between the parties.
The screen and the 0–10 scale built electorates that were far too large, about 60% of adult citizens, and younger than the halfway and corrected versions suggest. But they got the balance between Harris and Trump voters closer than our model did (52% Harris), which is why their estimates landed nearer the result.
The best outside check we have points the same way. The Voter Poll, conducted by SSRS for several news organizations among about 79,500 voters, is weighted to match the actual result in each state, so its picture of who voted is anchored to the count. Among its respondents who said they voted for Harris or Trump in 2024, 53% said Harris (49% to 44%). That's the same as in all three of our versions, and above the 51% our model expected. It rests on what voters remember about 2024, though, so it's a check, not proof.
So the electorate our model expected was off in the one way that mattered for the result: it had too few Harris voters relative to Trump voters. It's the same mistake we saw among the people who answered, now showing up in the electorate as a whole.
How close would we have been with the right turnout?
Had we known who would vote, our October poll would have landed between D+12.8 and D+14.7, depending on how much of the reported turnout we treat as overstatement. The like-for-like result is D+13.2.
To get there, we take each person's October answer and count it only if they actually voted. We show all three versions of who voted: face value, halfway, and corrected.
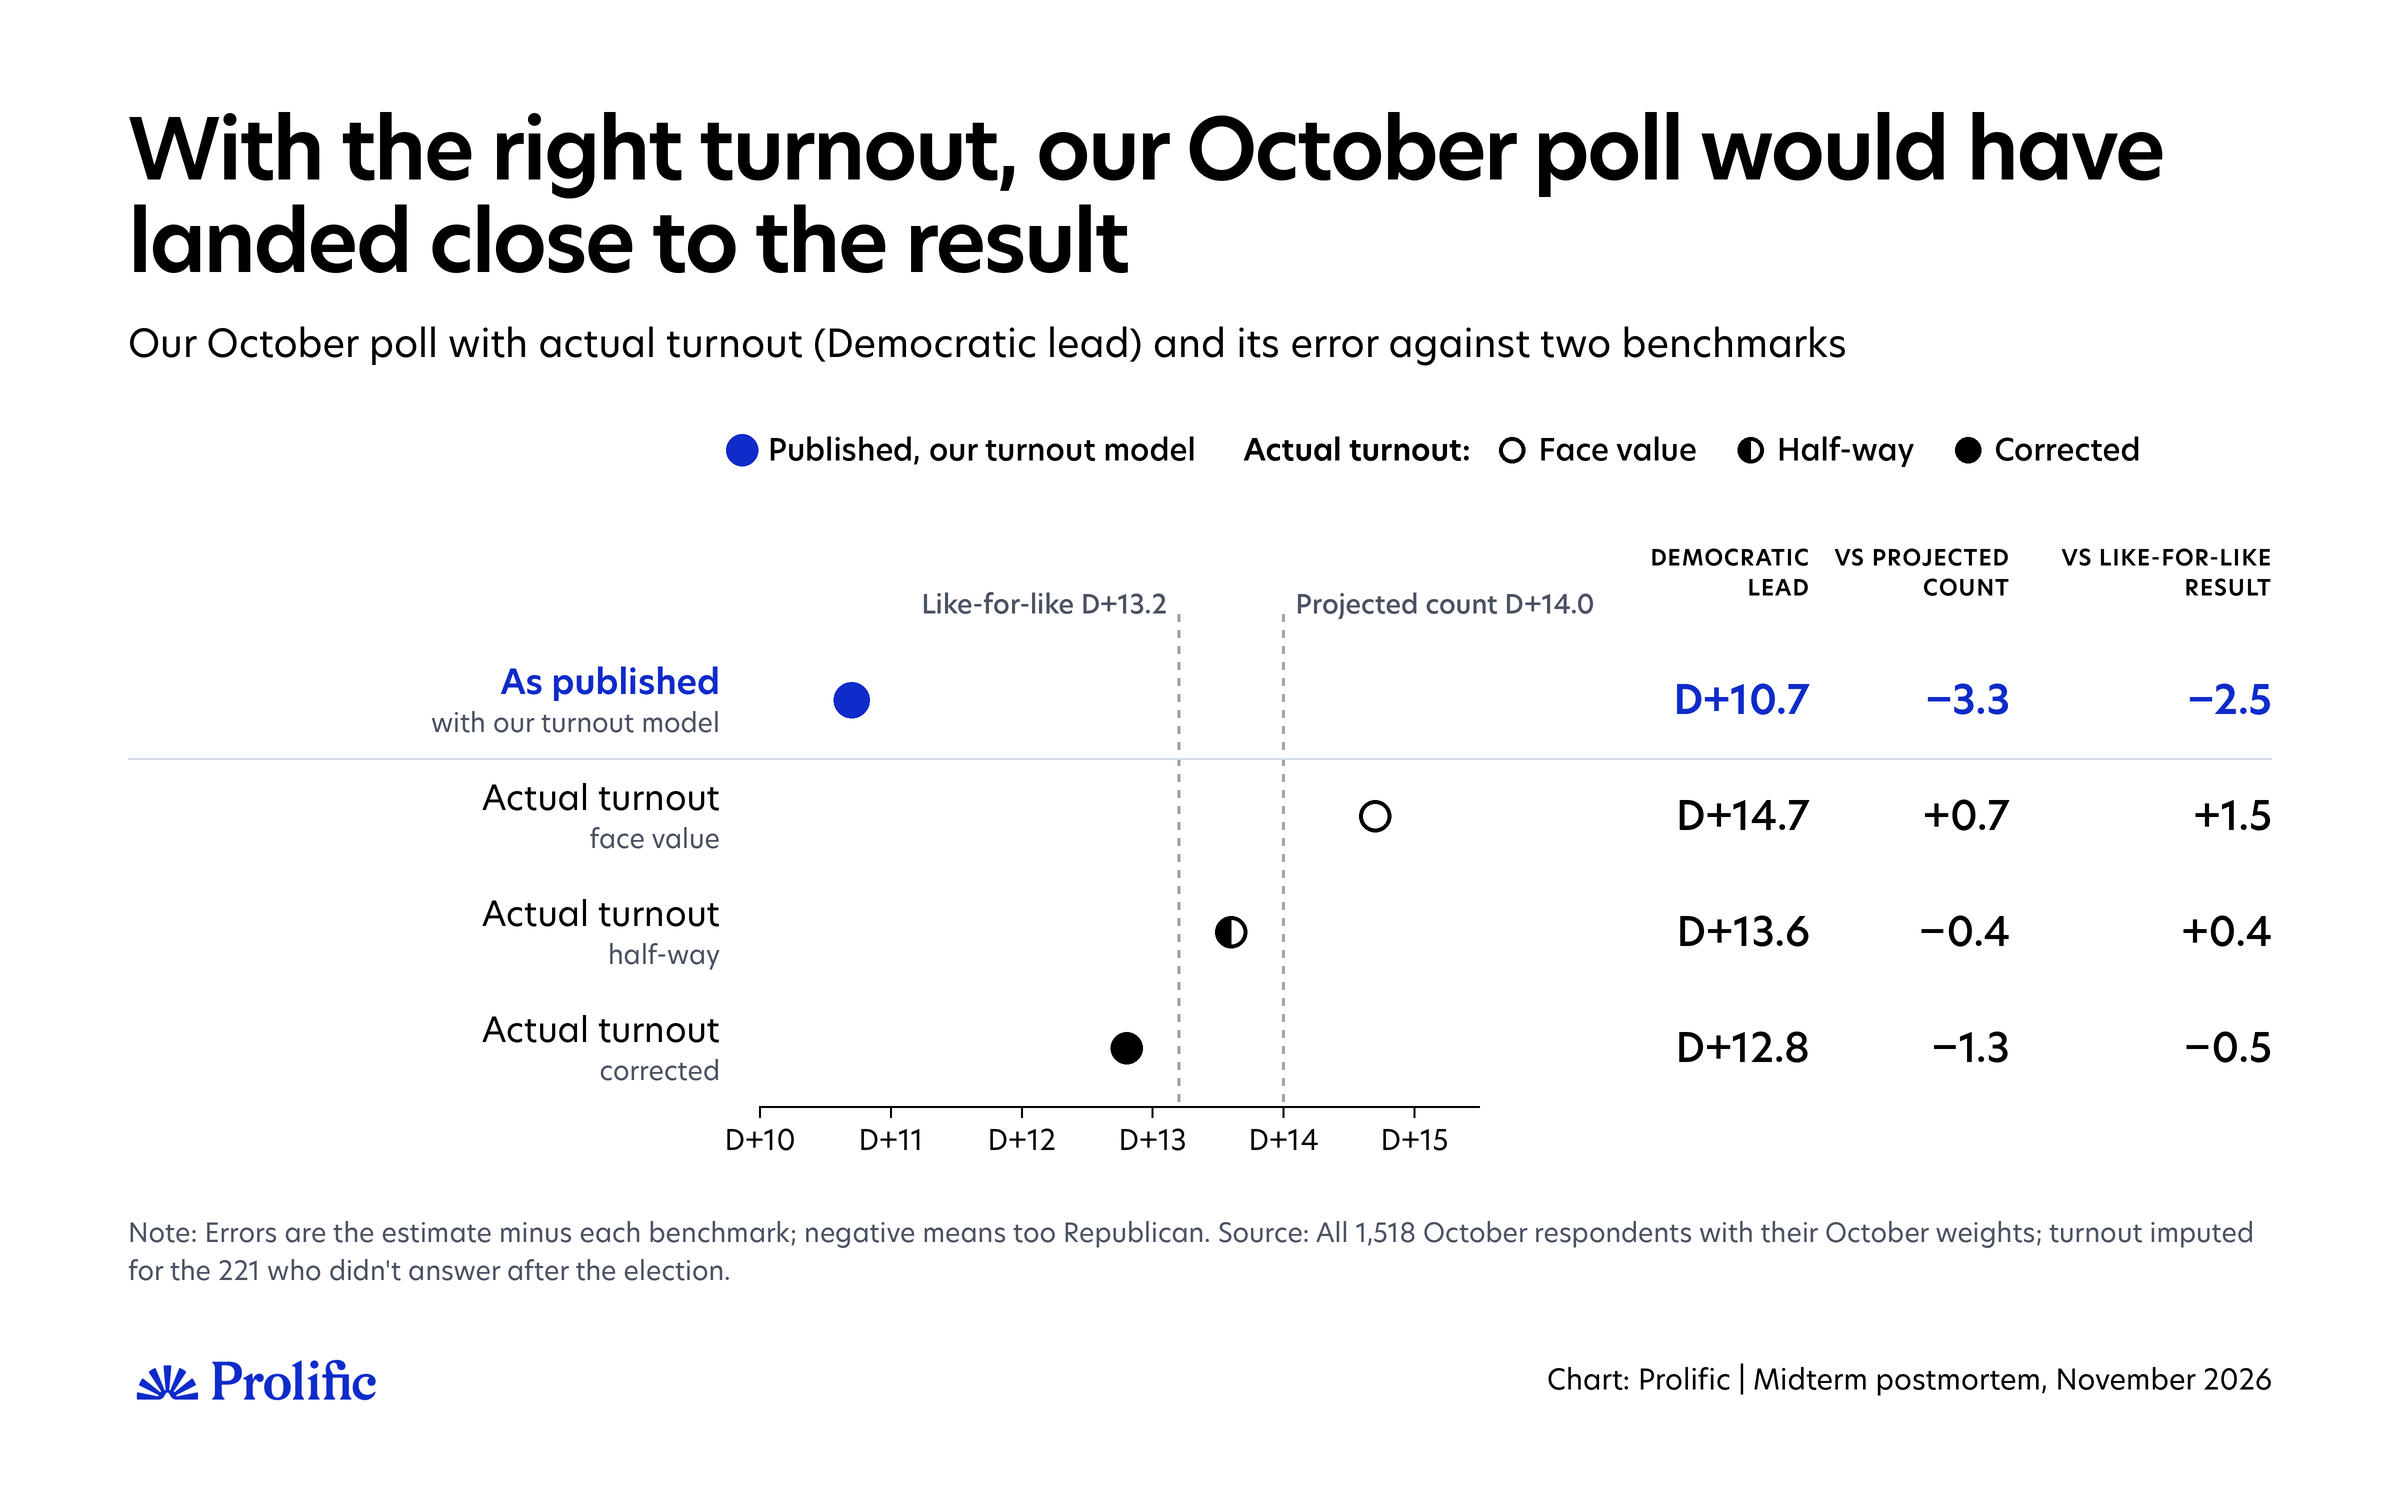
All three versions move the estimate toward Democrats enough to narrow the gap somewhat. Whatever we assume about over-reporting, getting turnout right accounts for much of our miss. The corrected version lands 0.5 points short of the like-for-like result, the halfway version 0.4 points over, and taking every claim of having voted at face value 1.5 points over.
Could a better turnout model have fixed it?
Every likely-voter model has to balance two kinds of evidence: what people say about their plans, and what we know about people like them from past elections, such as whether they voted before, their age, and their education.
Pew's study of likely-voter models in the 2014 midterm found that the best ones combine both. Ours does, and it sets the balance from three past midterms. Its one big assumption is that the link between what people say and what they do is the same this year as in those elections.
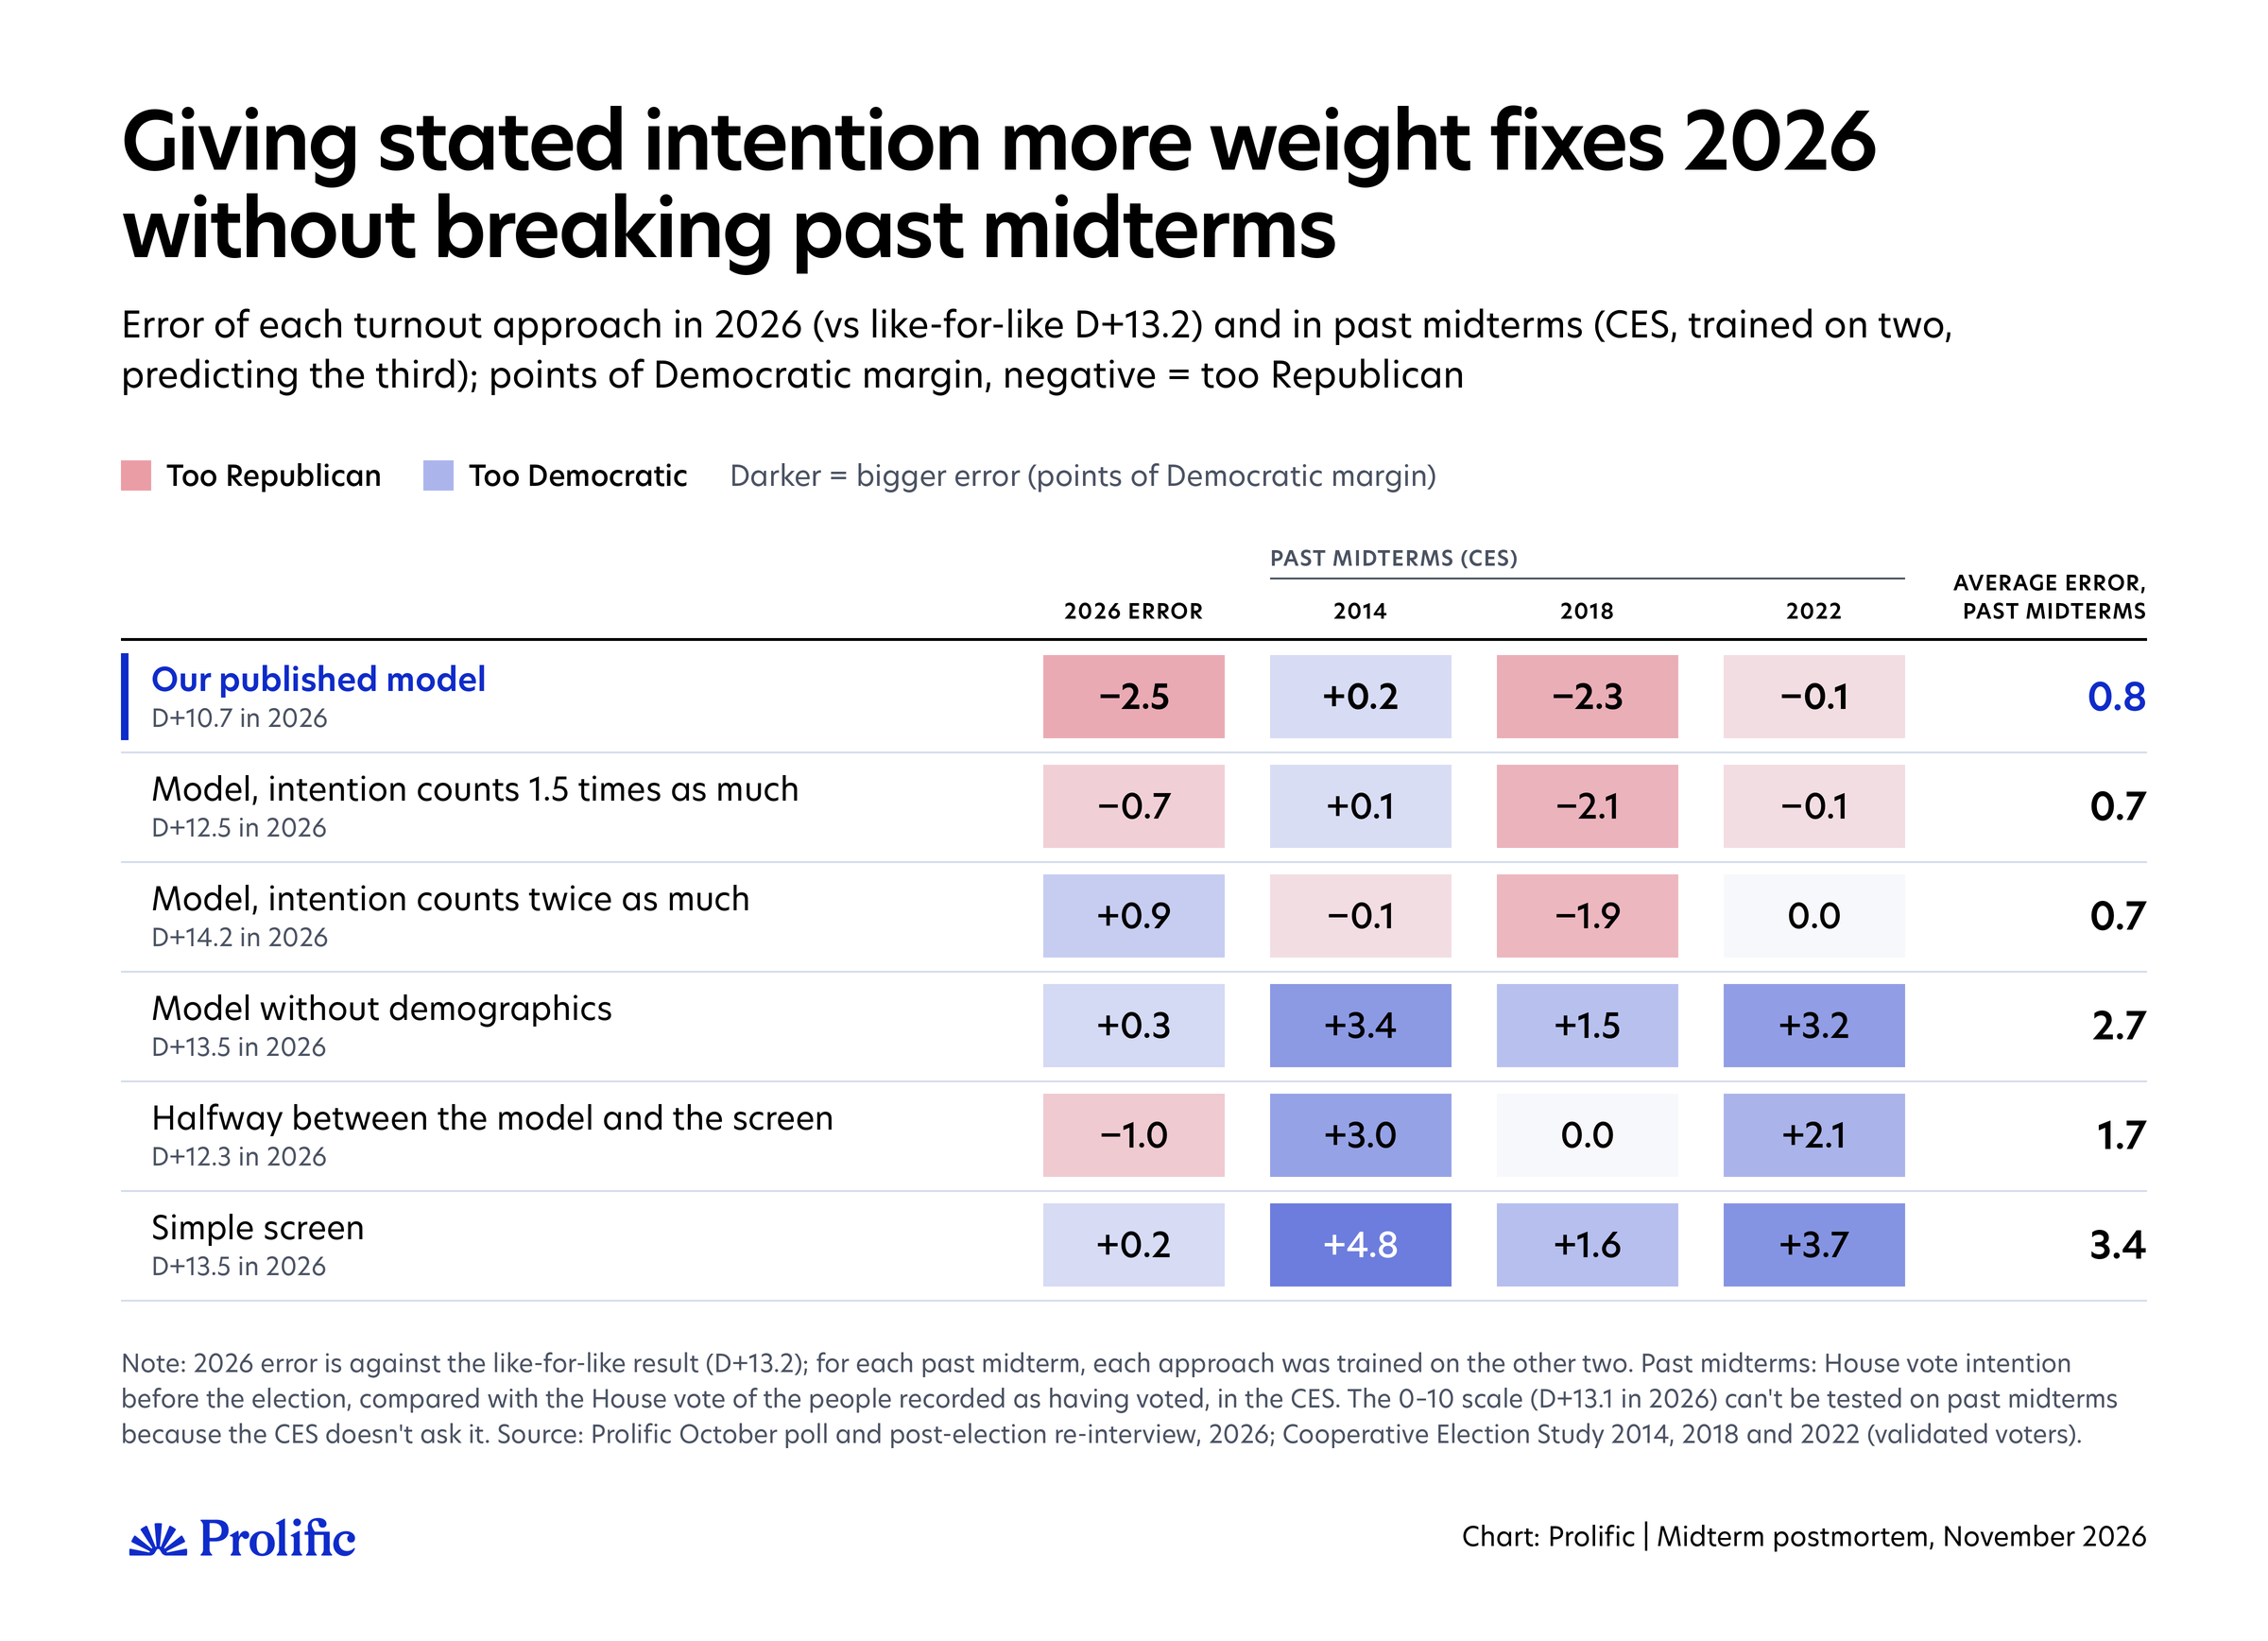
In an enthusiasm-gap year, that assumption is exactly what's in doubt. When one side is unusually motivated, its supporters' stated intentions carry information that past patterns don't. The keen voters on that side are more likely to follow through than people like them used to be, and the unenthusiastic voters on the other side less so.
So the alternatives we test aren't a random menu. Each one relaxes that assumption in a different way, and each corresponds to a different explanation of what went wrong:
Stated intention mattered more than usual. We keep the model but increase the weight it gives to intention by 1.5 times and 2 times, leaving past voting, registration, and demographics as they were. This is the most direct test of the enthusiasm-gap explanation.
The demographic part of the model penalized the wrong people. We drop age, education, race, and sex and keep only intention, past voting, and registration. If the model went wrong because it discounted young and less-educated Harris voters for being young or less educated, this should fix it.
No single method can be trusted, so hedge. We average each person's probability from the model and from the simple screen.
Take people at their word. The simple screen itself.
A fix that only works this year is no fix at all. It could be pure chance or, worse, overfitting to one election. So we tested every alternative on 2026 and on the three previous midterms. For those, we used the CES with official voting records, training each version on two midterms and predicting the third.
Three things stand out:
The demographic explanation fails. Dropping demographics, and the screen that ignores them, land close in 2026 but overstate Democrats by 1.5 to 5 points in every previous midterm. In normal years, the demographic information does useful work. Dropping it worked this year only because 2026 happened to be a year when enthusiasm lined up with party.
The enthusiasm explanation holds. Giving stated intention more weight changes almost nothing in 2014 and 2022, because when both sides are similarly motivated, intention and past behavior point the same way. In 2018 and 2026, the two years when polls underestimated Democrats, it moves the estimate the right way. Counting intention 1.5 times as much would have cut our miss from 2.5 points to 0.7.
The warning was already in our own tests. When we tested our model in October, it was spot on in 2014 and 2022 but 2.3 points too Republican in 2018. This year, it was 2.5 points too Republican. Our October article showed what repeating the 2018 error would mean: D+12.0, the closest of our modeled estimates. We treated it as one scenario among several. We should have treated it as a known blind spot for a year with a clear enthusiasm gap.
The lesson is that a turnout model shouldn't be agnostic about the year it's in. A model trained on past elections averages over normal years. When our own data show one side far more certain to vote than usual, as they did in October, that's a signal the model should use by giving intention more weight in proportion to the gap, not average it away. Every version here was chosen with hindsight, so we will set that rule and test it on more past elections before the next election, not after.
Did voters change their minds at the end?
Not toward Democrats. The Democratic wave was already there in October. If anything, the late movement went slightly toward Republicans, and the latest deciders broke Republican. Among our respondents, late change can't explain the miss.
We interviewed the same people three times: in October for our published poll, again in the week before Election Day, and after the election. We also know how they voted in 2024 from their Prolific profiles. The chart follows all 1,518 October respondents through those four points. People who didn't answer a later interview remain in their own group, so nobody drops out of the picture.
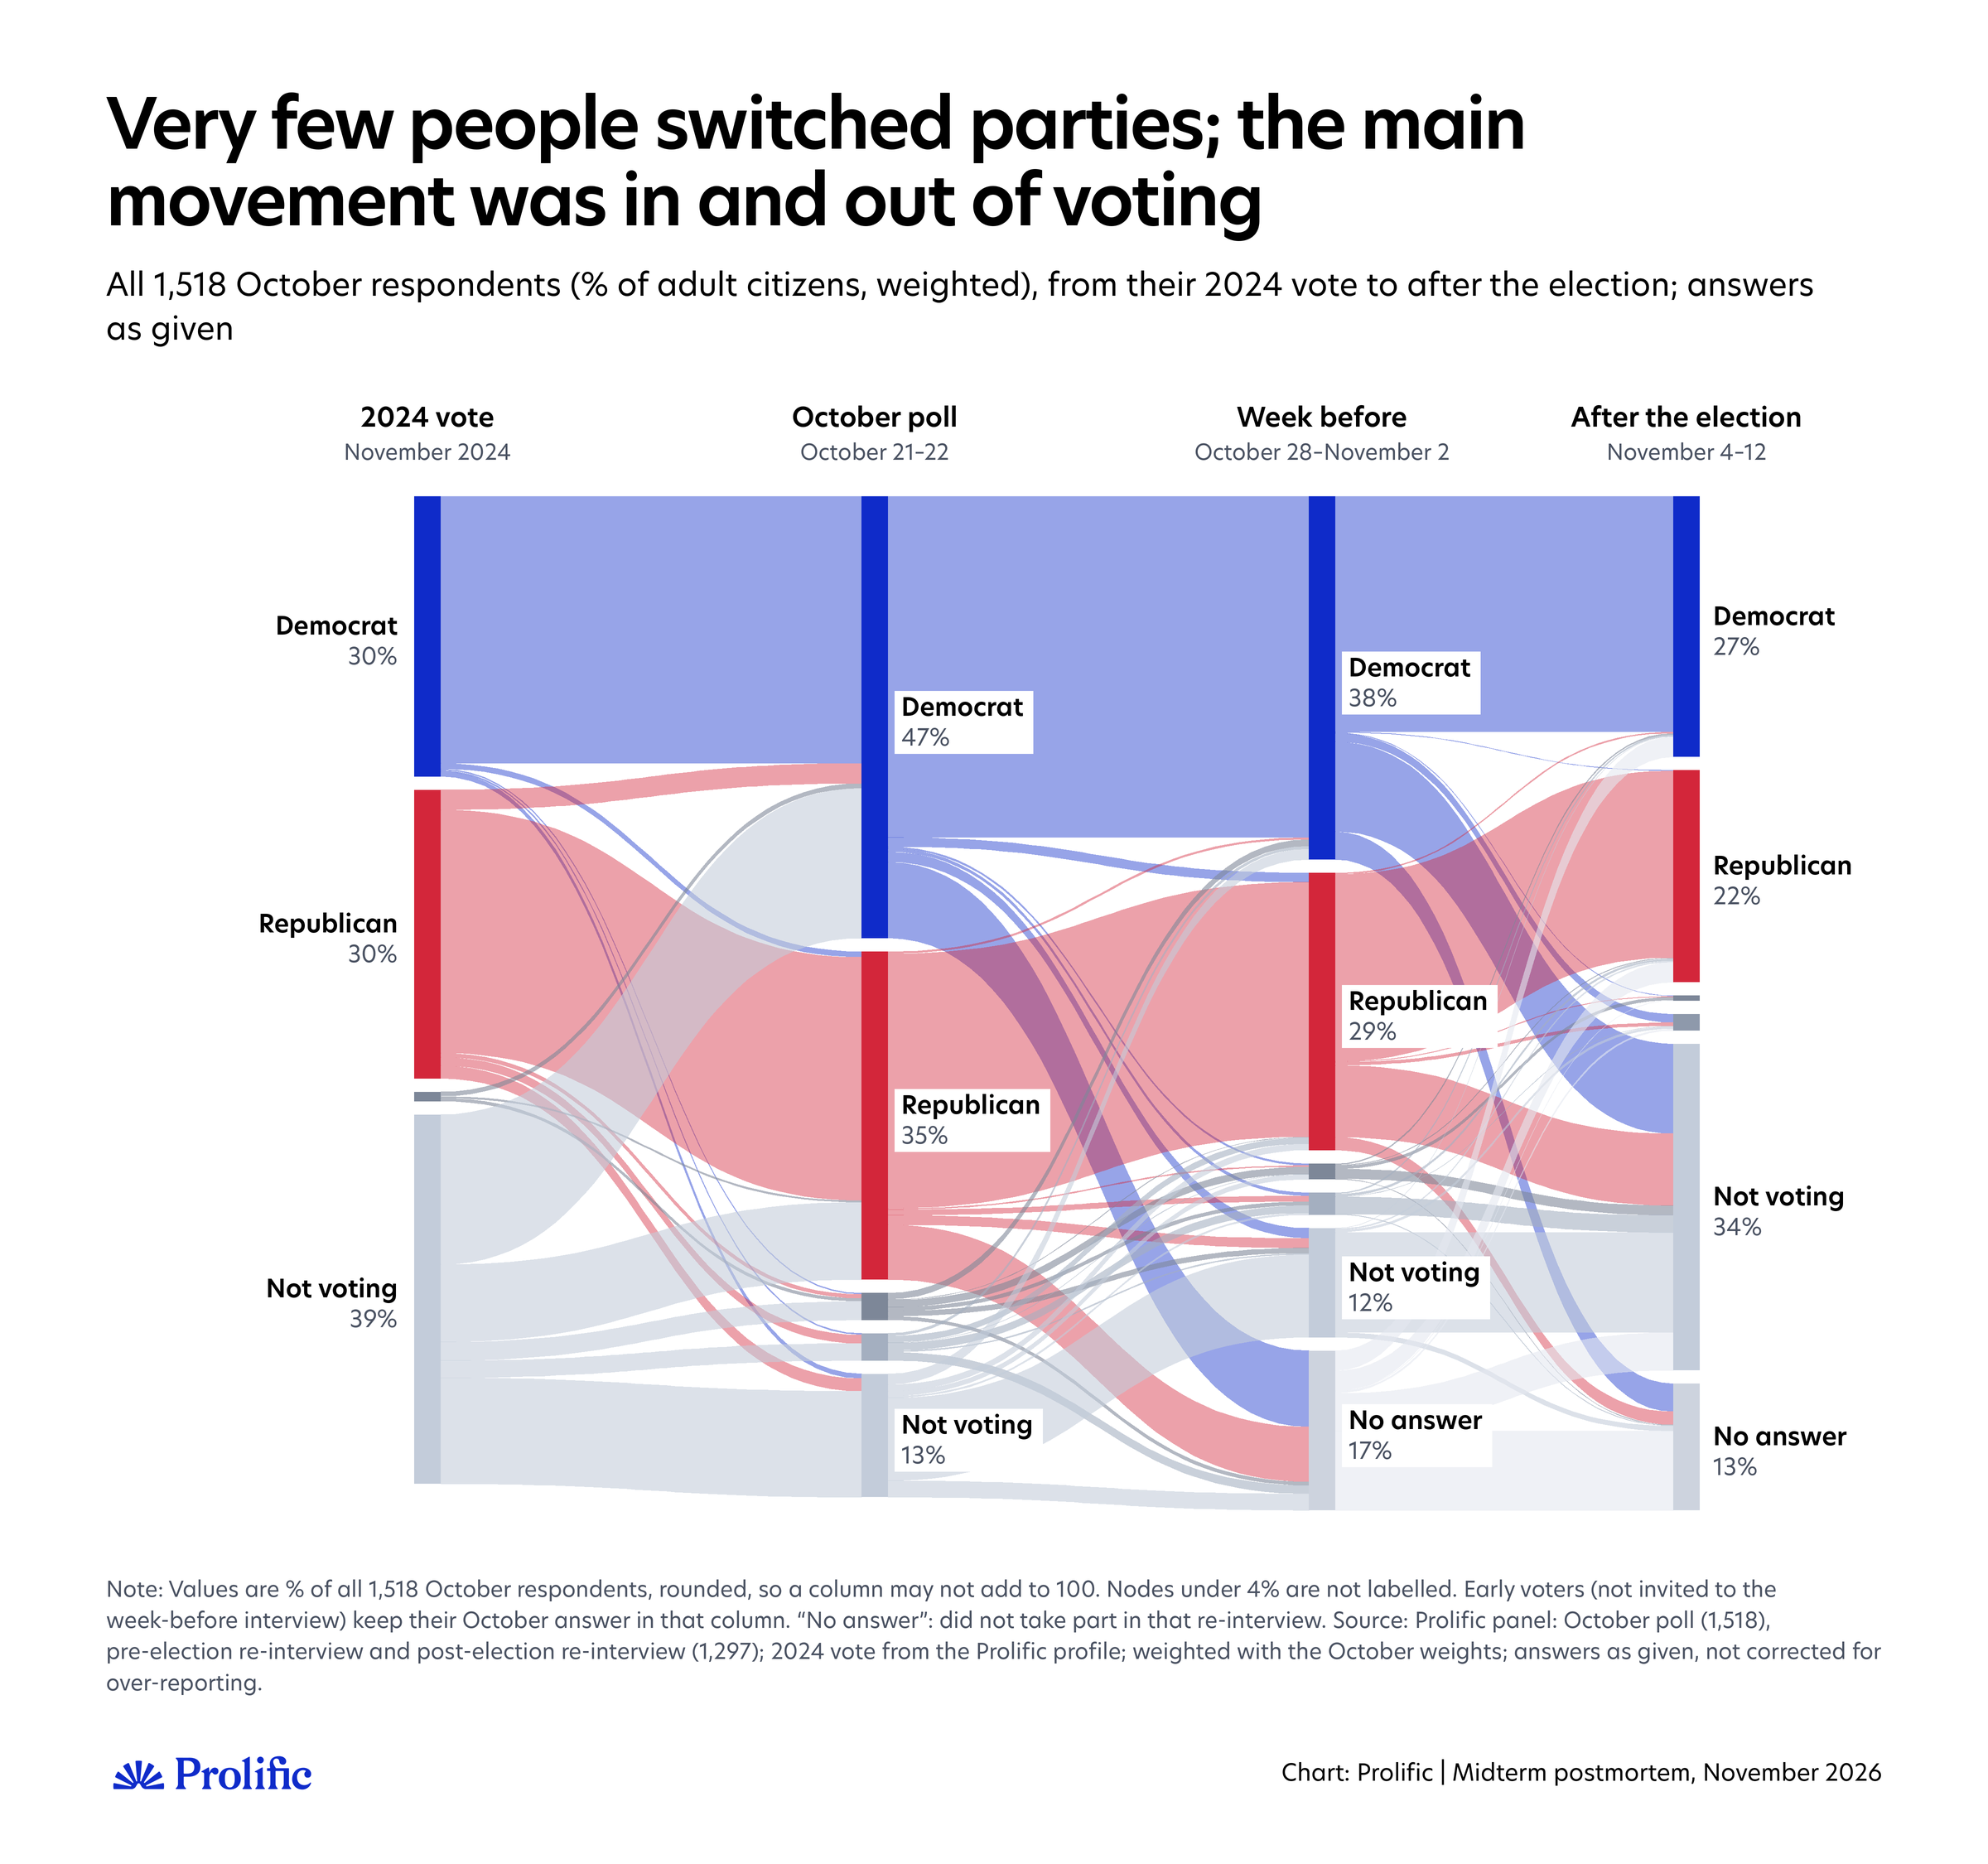
Read the chart from left to right. The big move happened before our October poll, and it was mostly people who hadn't voted in 2024 choosing Democrats: 16% of all respondents went from not voting in 2024 to backing Democrats in October, against 8% to Republicans. A few Trump voters crossed to Democrats (2%), and almost no Harris voters crossed the other way (0.6%).
After October, the party lines barely moved. Between October and the week before Election Day, about 1% of respondents moved from Democrat to Republican and 0.2% the other way. Between then and after the election, both flows were under 0.2%. Almost all the movement in the second half of the chart is people leaving or entering the electorate, and people who didn't answer a later interview. The thin ribbons between the blue and red bars show the full extent of party switching: among the voters we interviewed all three times, 92.6% named the same party every time.
The chart doesn't show a late surge toward Democrats. October's undecided voters were few (3%), and those who ended up voting split slightly toward Republicans. Democrats were sure and motivated from the start.
When people made up their minds
After the election, we asked when people decided how to vote for the House.
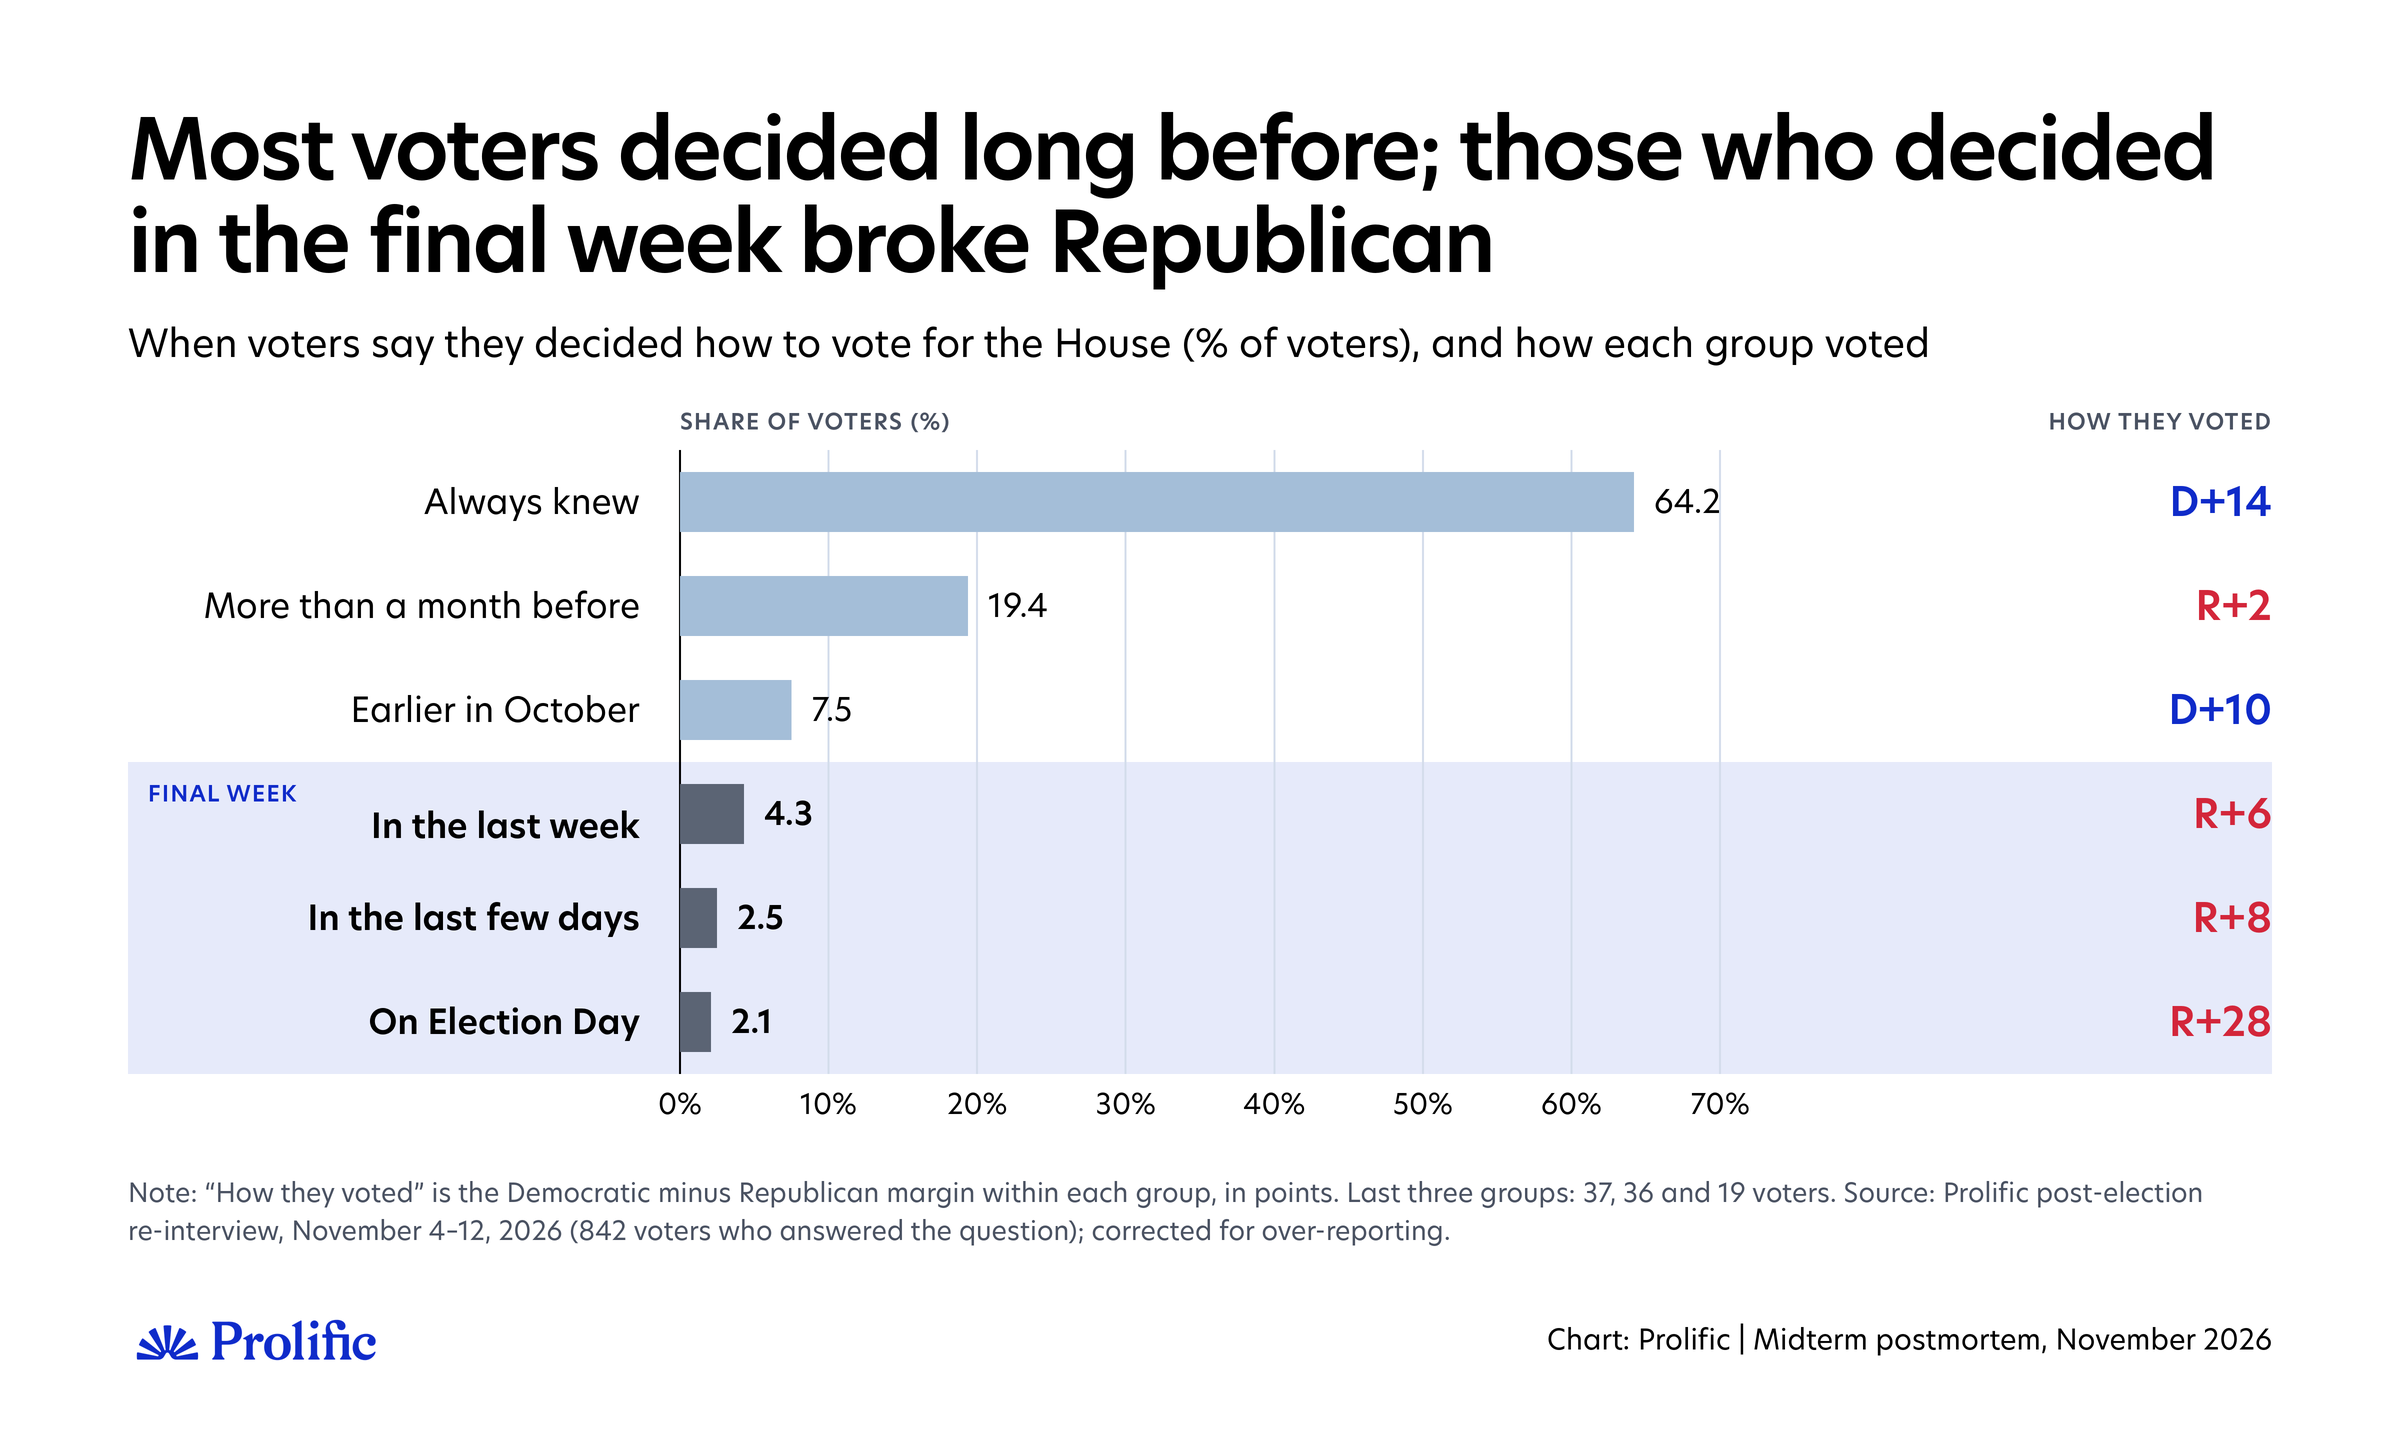
Most had known for a long time: 64% of voters always knew, and another 27% decided more than a week before. Only 9% decided in the final week, and all three groups leaned Republican, especially those who decided on Election Day. The groups are small, but they point the same way.
Late deciding is concentrated among the people who moved. Of those who voted for a different party from the one they named in October, 64% say they decided in the final week or on Election Day. Of those who were undecided, backed another party or didn't plan to vote in October, almost half did. Of those who stayed with their October party, only 7% did.
These are real changes, not noise in the answers. 107 people had already voted when we polled them in October. After the election, 103 of them reported the same vote, the other four said they didn't vote in the House race or didn't remember, and none switched party.
Was our sample or our weighting the problem?
Before weighting, our sample leaned too Democratic, not too Republican, and weighting pulled it into line. And had we got turnout right, none of the alternative weighting schemes we tested would have done clearly better than the one we used.
Before weighting, the sample leaned Democratic
We sample from Prolific's panel to fill planned numbers of people in 25 groups. Some groups end up a little over- or under-filled compared with the plan, and design weights correct for that. Weighting then lines the sample up with the population on demographics, past vote, registration, and party.
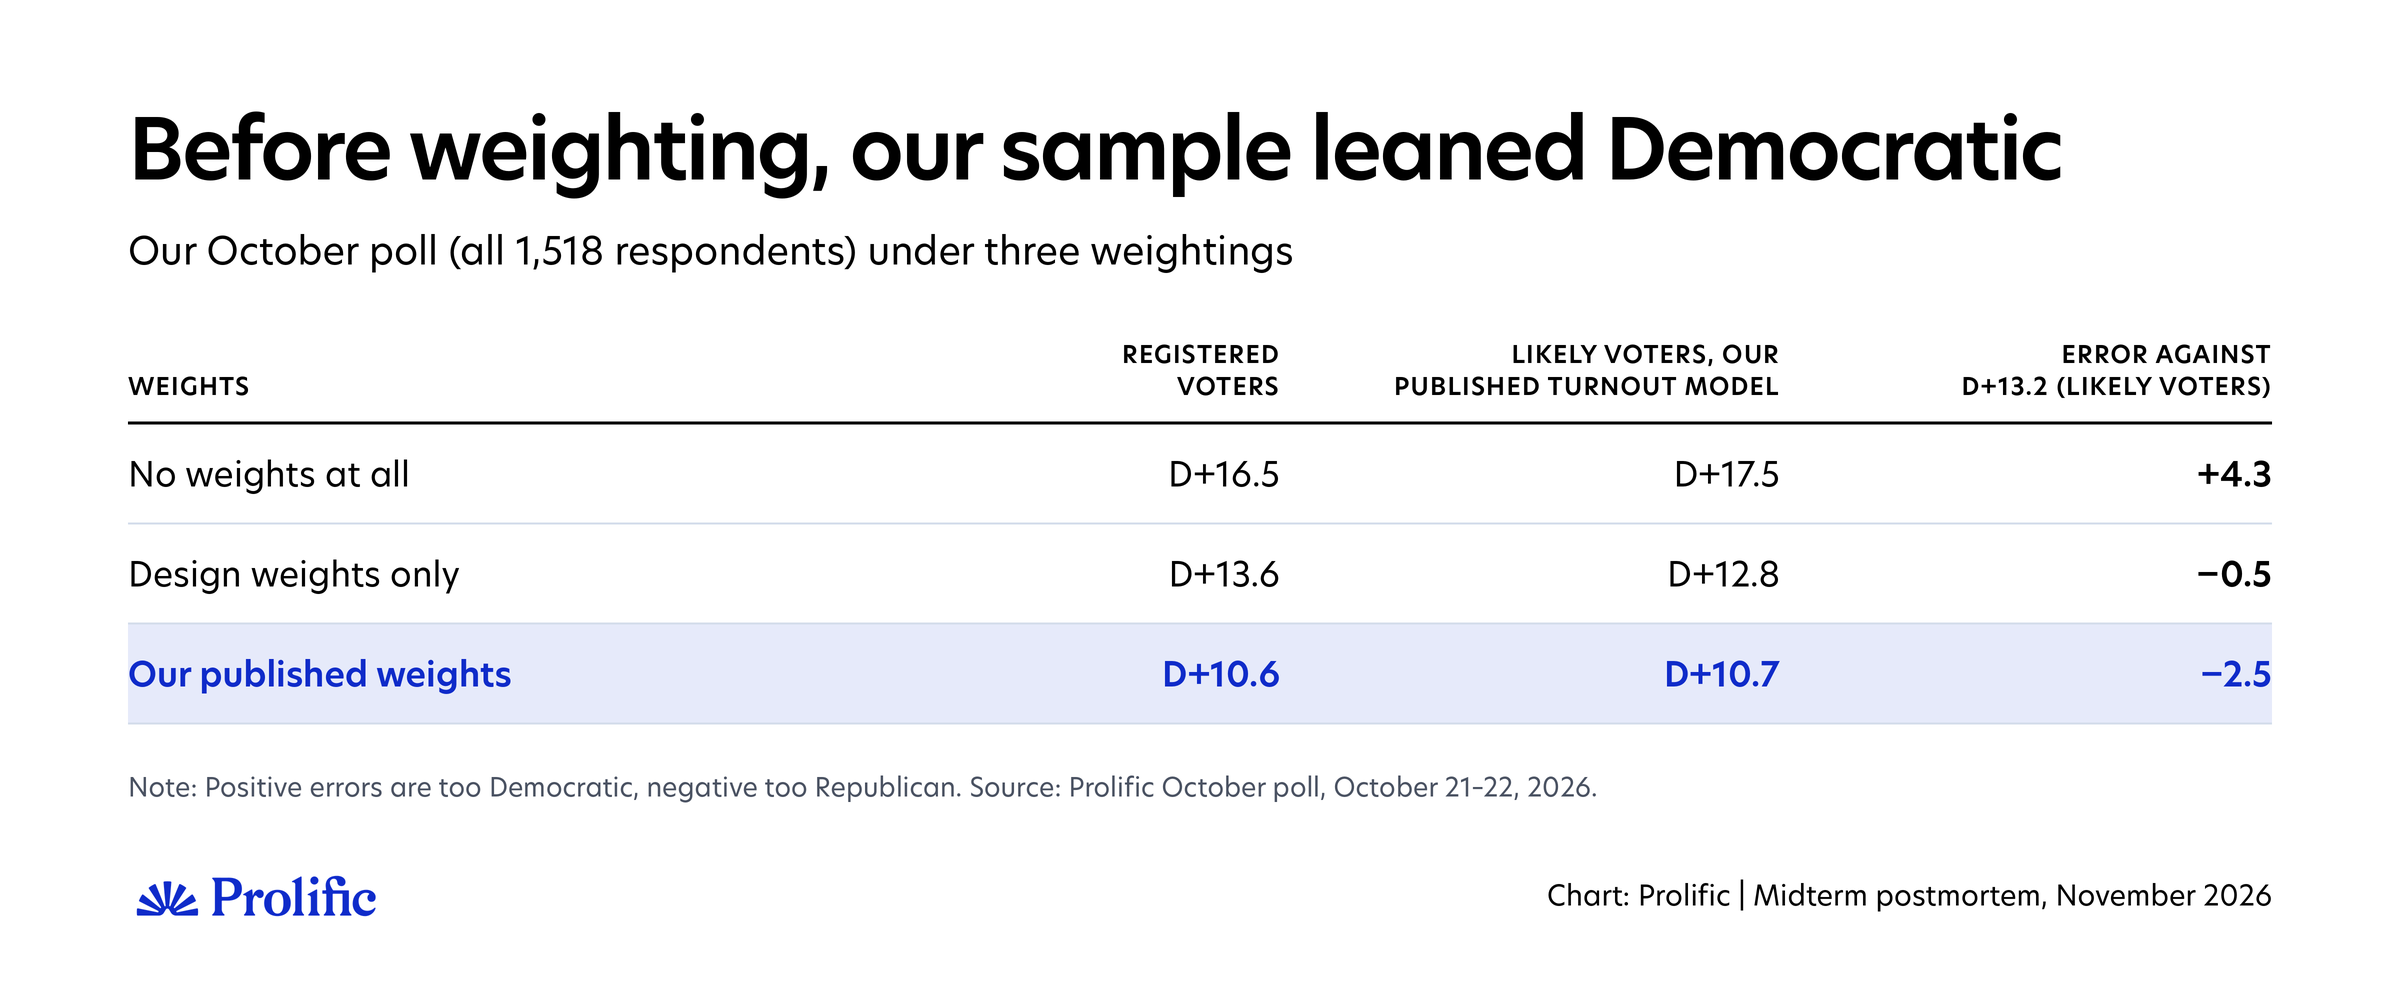
Taken raw, our sample was 4 points too Democratic. The design weights alone happen to land close to the result, but that's two errors canceling: a sample still a little too Democratic, and a turnout model too Republican.
Did we reach the right voters within each 2024 group?
Weighting to the 2024 vote makes sure we have the right number of Harris voters, Trump voters, and non-voters. It can't make sure we have the right kind within each group.
For example, if Trump voters drifting toward Democrats were less likely to take our survey, our Trump voters would look more loyal than Trump voters overall. Following Morris, we check this by comparing how each 2024 group voted for the House in our data with the Voter Poll, which interviewed tens of thousands of actual voters.
Among Trump and Harris voters, the match is close, as Morris found in his own poll. Our Trump voters who said in October that they would definitely vote backed Republicans 92% to 6%; in the Voter Poll, Trump voters backed them 91% to 7%. Harris voters match almost exactly. If Trump voters drifting toward Democrats had been avoiding our survey, our Trump voters would look more loyal than the Voter Poll's. They don't, and the same holds for how our respondents actually voted.
The one gap is among people who didn't vote in 2024. Those who told us in October that they would definitely vote match the Voter Poll (72% to 21%, against 71% to 25%). But the 2024 non-voters in our panel who actually turned out voted much less Democratic, about 54% to 38%.
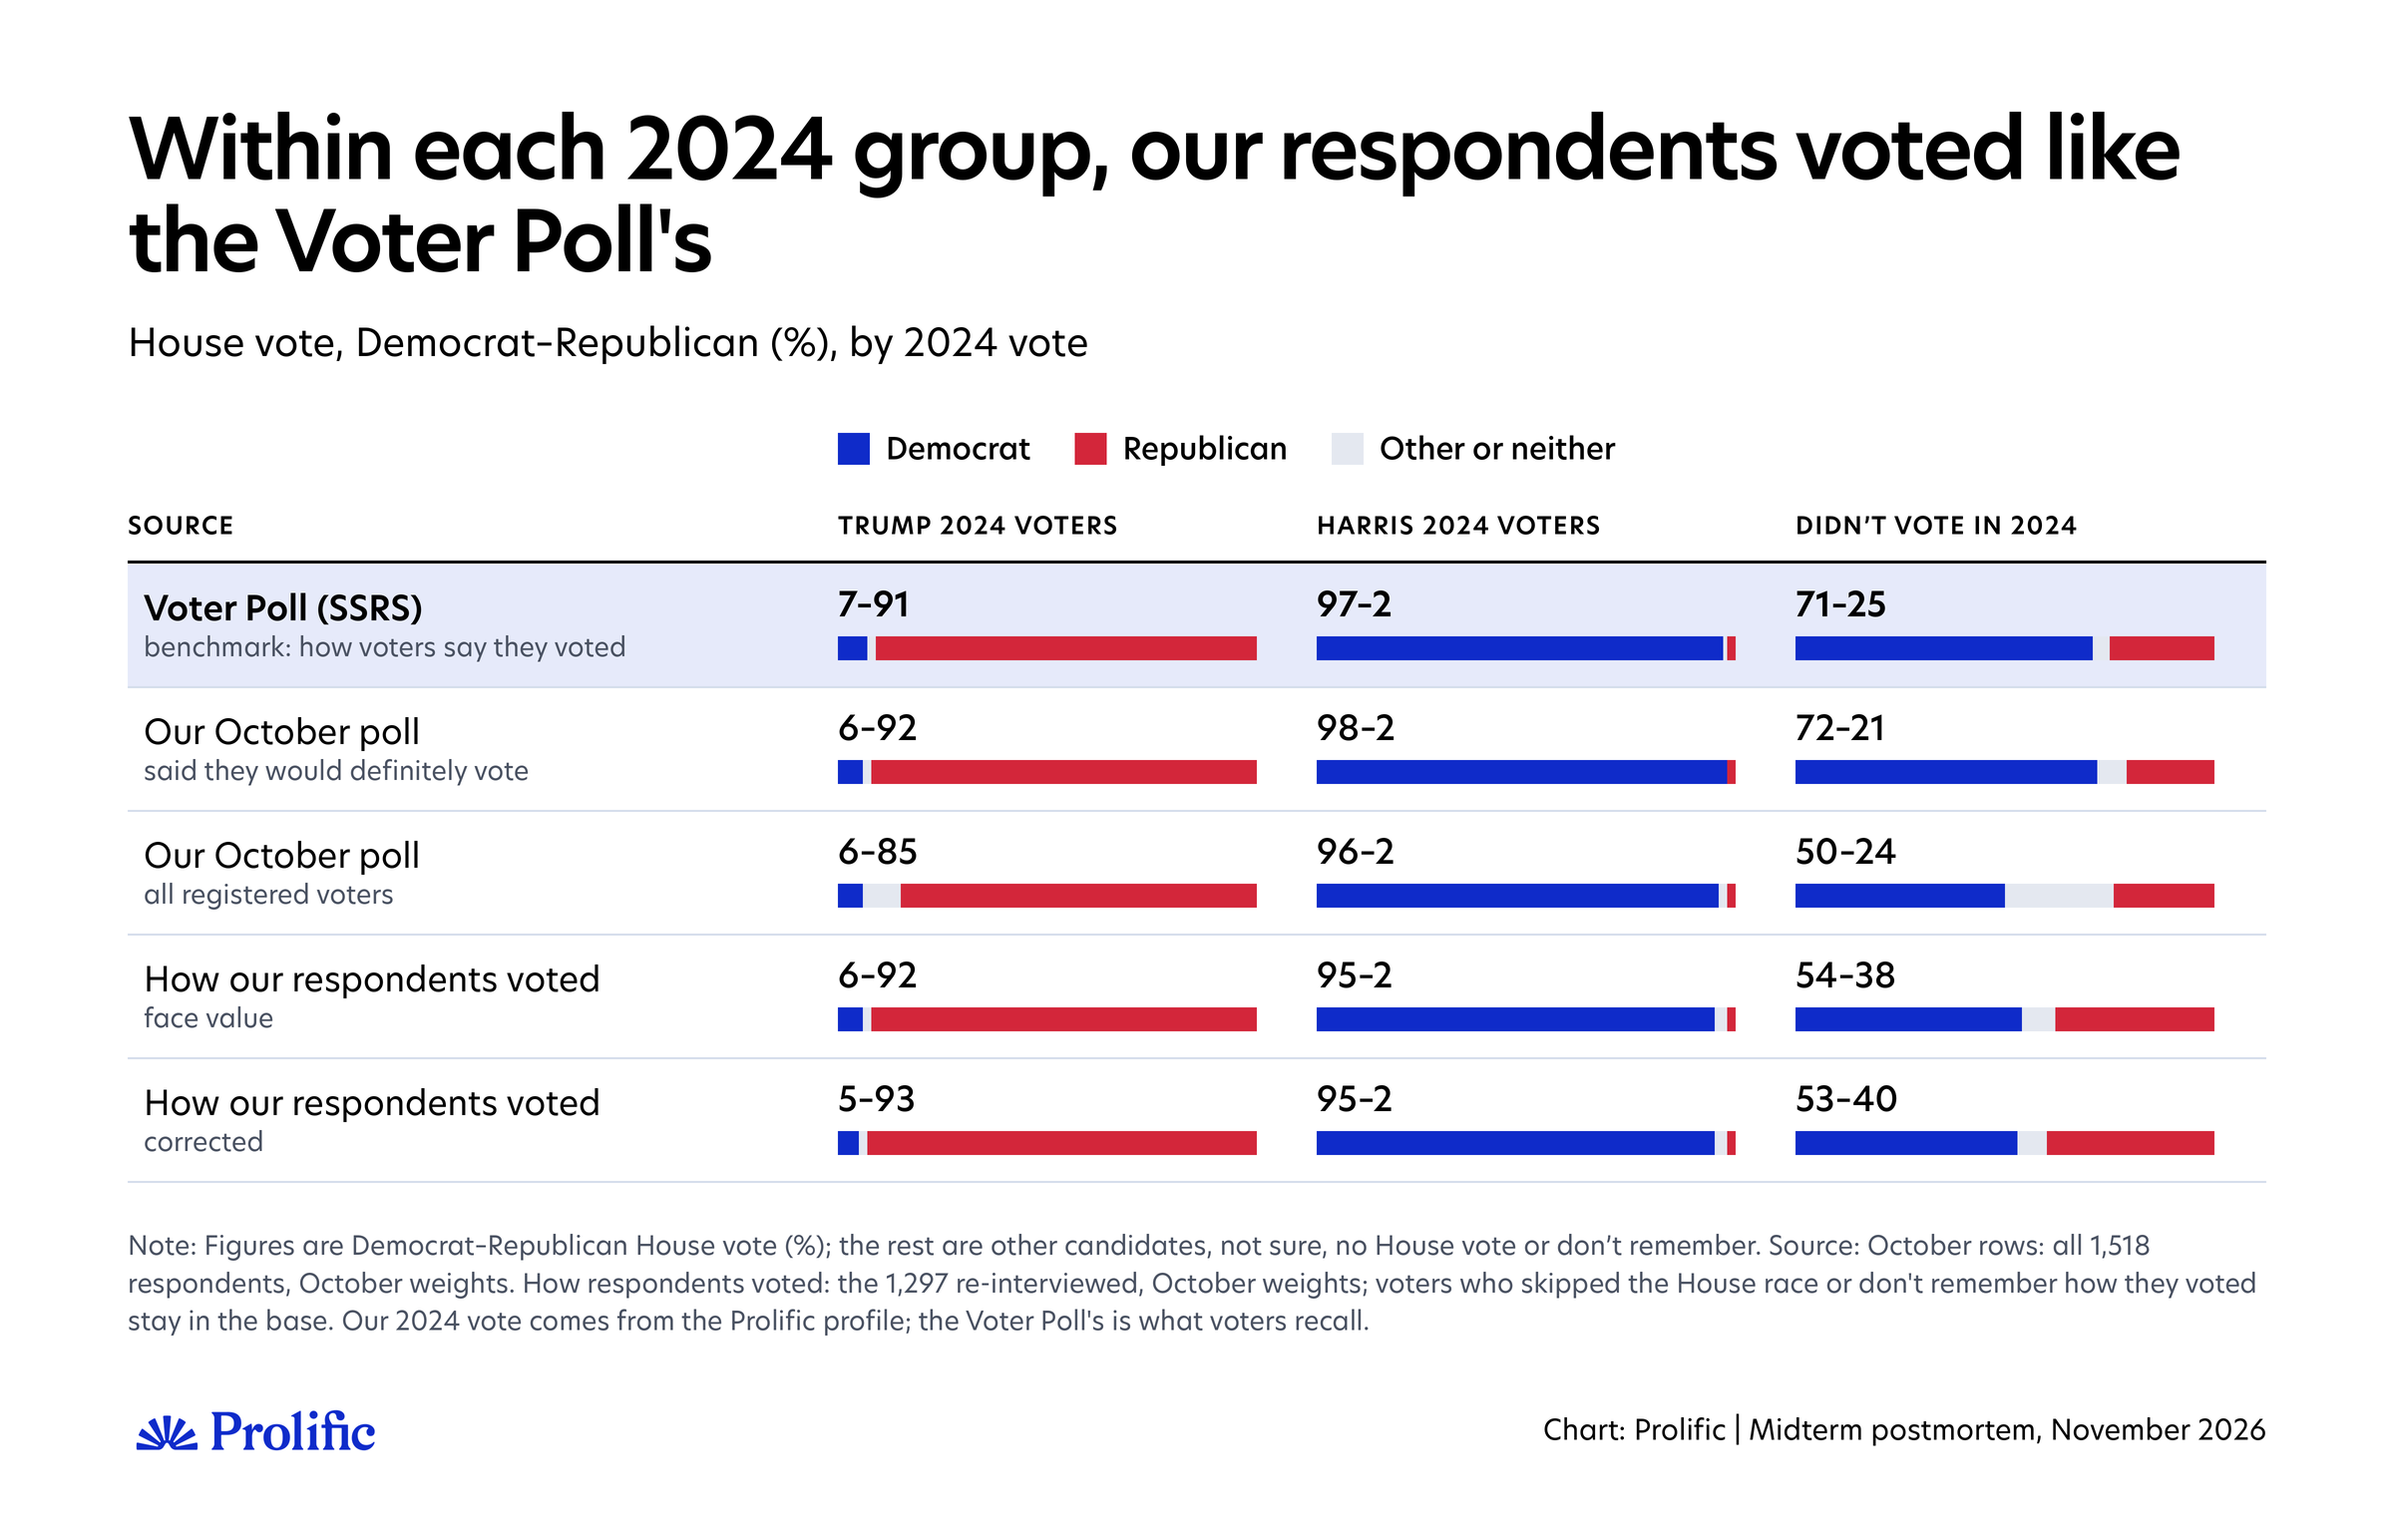
Two things are likely at work, and neither points to Democrats missing from our sample.
First, the groups aren't the same. Ours come from Prolific profiles; the Voter Poll groups come from what voters remember, and only 4% of its voters say they skipped 2024, compared with 12% to 15% in our estimates.
Second, the 2024 non-voters who turned out included many who were unsure in October, a group that, as the late-change section showed, broke Republican. These groups are also small (111 voters in our panel), so the gap is uncertain.
If we had got turnout right, would different weights have done better?
The cancellation we saw with the design weights is why we look at weighting separately. A weighting scheme can look good only because it offsets a turnout error, as the design weights did here, or look bad because of one.
To judge the weights on their own, we change only the weights and compare them under two conditions: our published turnout model, which we know was wrong, and actual turnout, using what people told us in October. For actual turnout, we use all 1,518 respondents, imputing the 221 who didn't answer after the election, and show all three versions of who voted.
Beyond the steps in our scheme, we tested the four alternatives we flagged in October as defensible. Each one answers a specific doubt about our choices:
Pew's three-year average for party ID, instead of 2026 alone. The cautious choice if Republicans' drop in party identification in Pew's 2026 survey was partly noise. It makes the sample more Republican.
Independents who lean to a party kept as independents. Some pollsters do this because leaning is the softer part of partisanship. It makes the sample more Democratic.
Recalled 2024 vote instead of the vote in the Prolific profile. What most pollsters do, because they have no record of how people voted.
Census Current Population Survey demographic targets, instead of the American Community Survey. A more recent but smaller source, which shows a slightly more educated and less employed population.
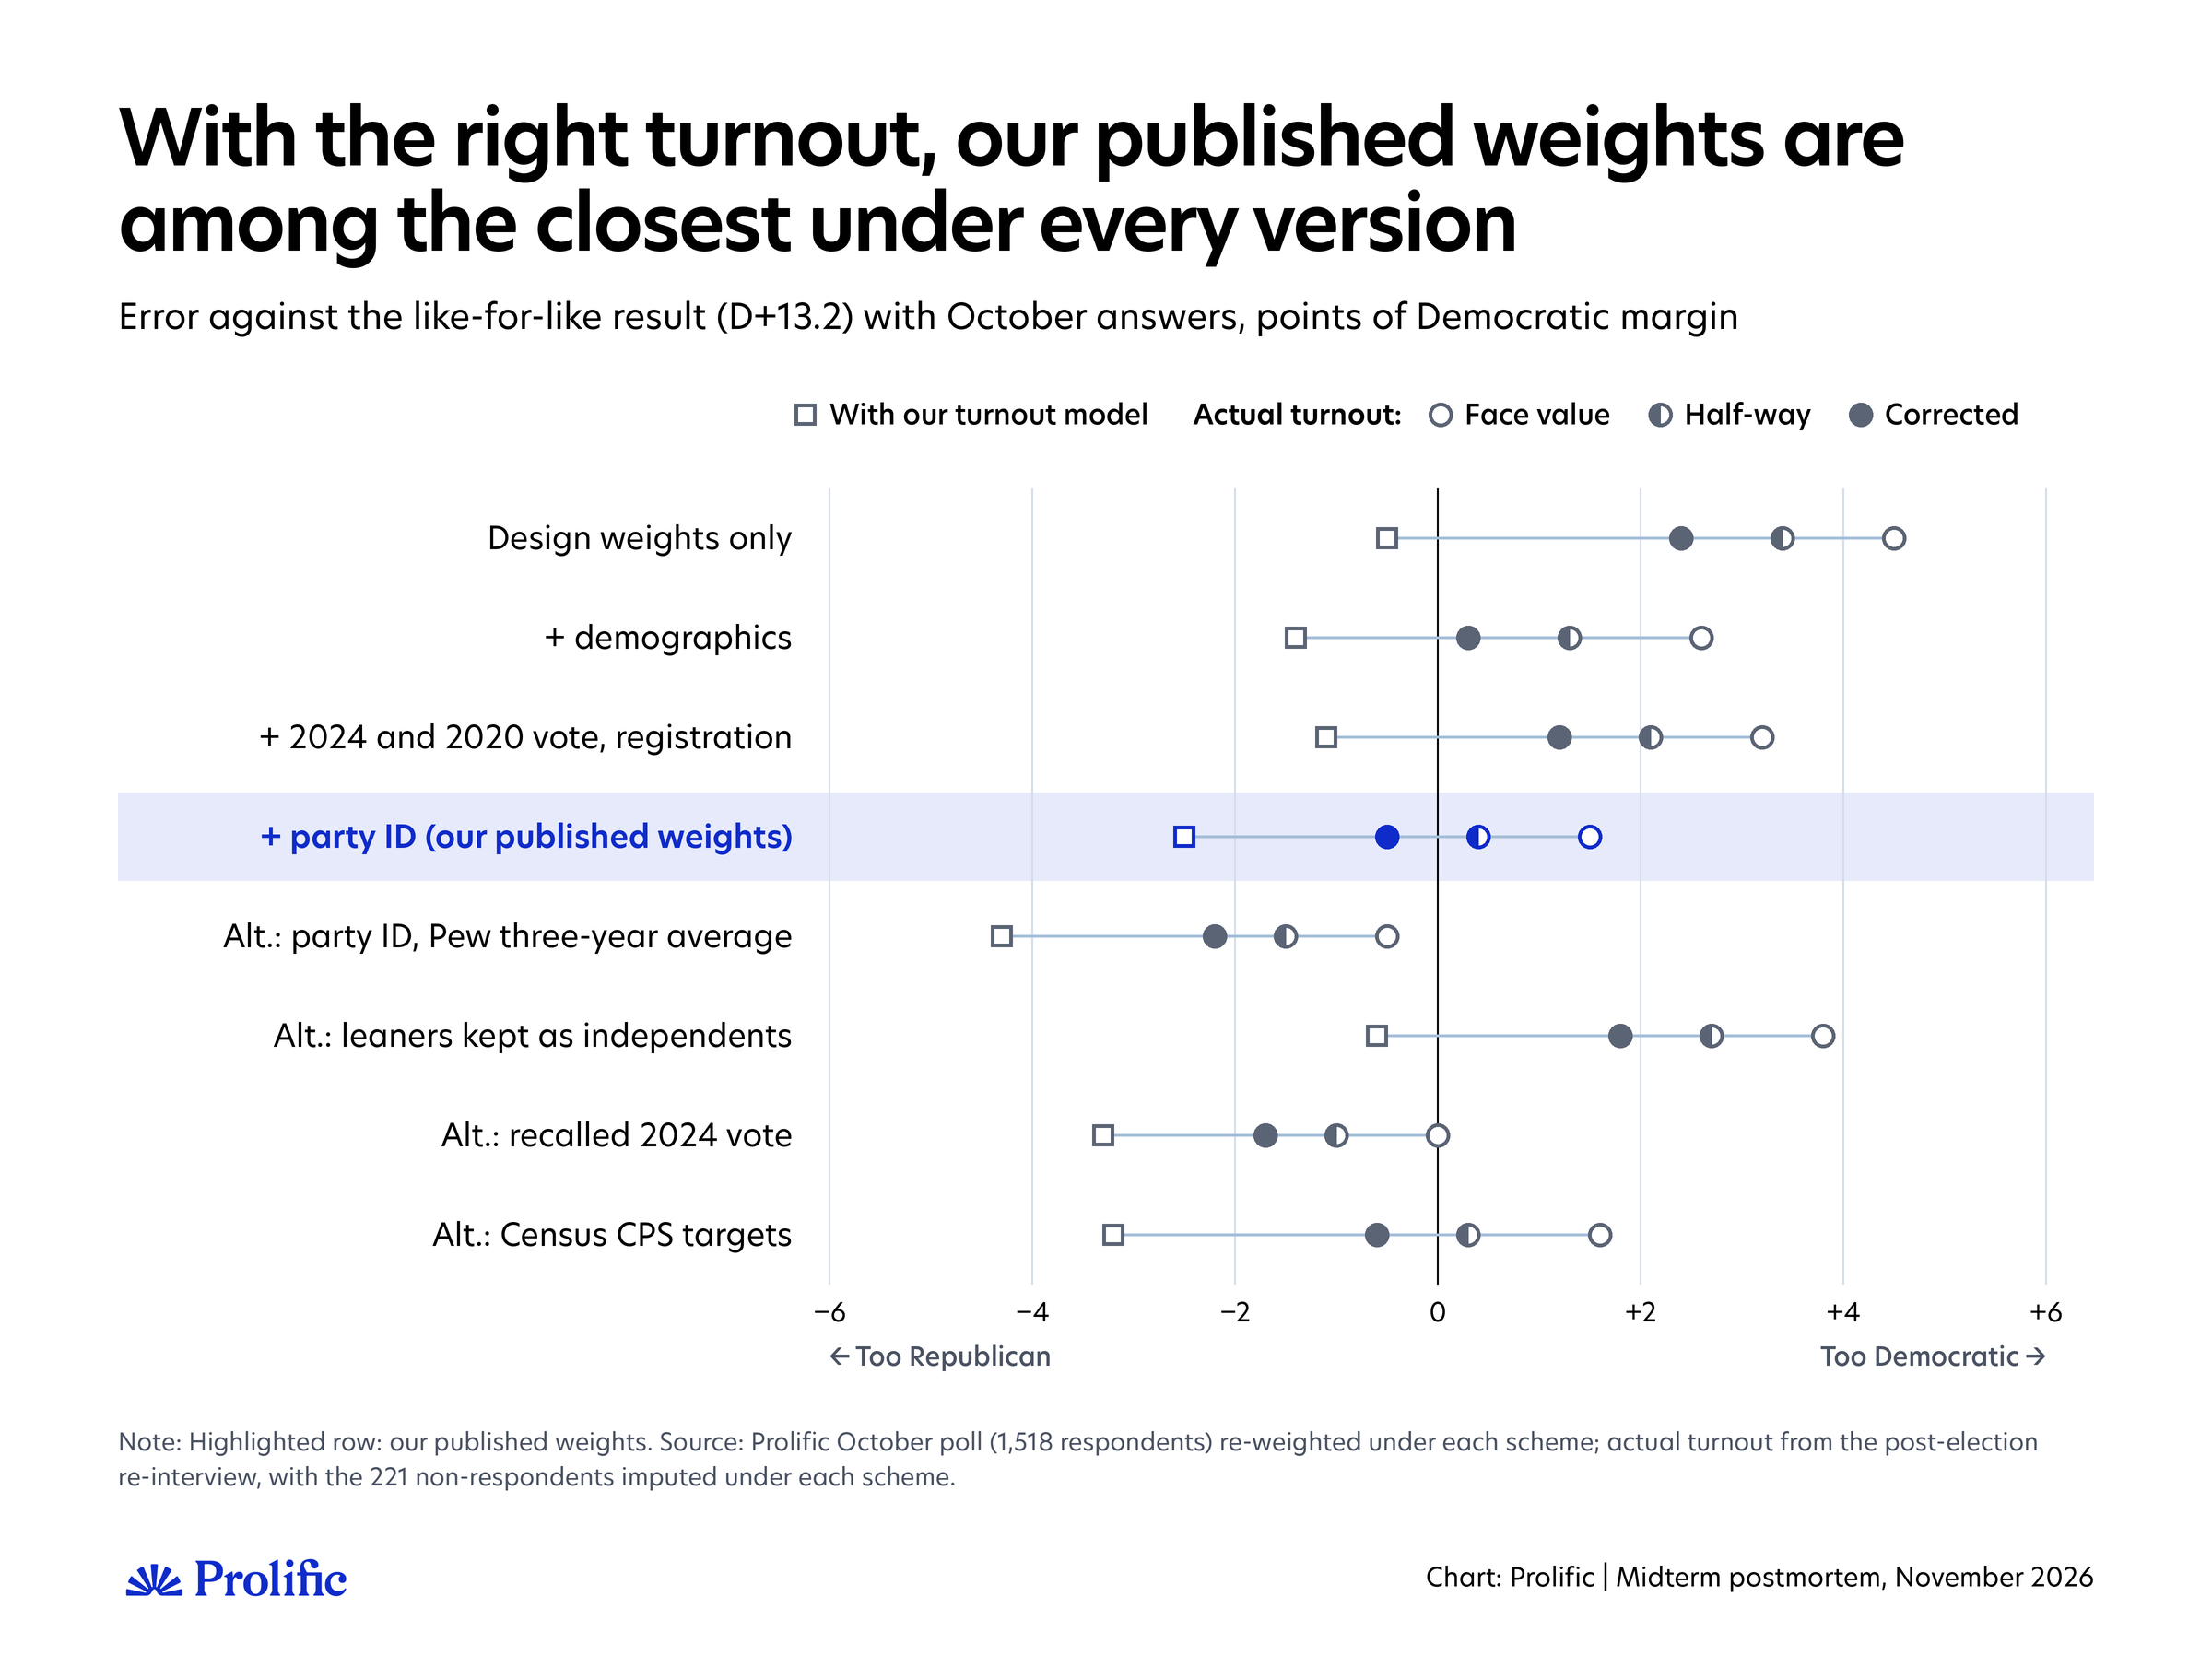
With our turnout model, every scheme lands too Republican. The two that come closest, design weights only (−0.5) and leaners kept as independents (−0.6), leave the sample most Democratic. They look good because their error runs the opposite way to the turnout model's.
With actual turnout, the picture flips: they land 2.4 to 4.5 and 1.8 to 3.8 points too Democratic, respectively, depending on the version. Our published weights land 0.4 points over the like-for-like result halfway, 0.5 points short with the full correction, and 1.5 points over at face value.
What should we make of a scheme that looks worse in theory but lands about as close in practice? There are two readings. It may correct a real bias that ours misses, in which case we should switch. Or it may add an error that happens to cancel another one, in which case it won't be right next time. The way to tell them apart is whether we can name the error.
Under the halfway and corrected versions, two schemes come close to ours. The Census CPS targets (+0.3 and −0.6) differ from ours only in where the demographic benchmarks come from, so that's what we would expect.
Demographics alone (+1.3 and +0.3) need some context. Our sample is already balanced on past vote by design, because we invite people from Prolific's panel in proportion to how groups voted, alongside their demographics. So "demographics alone" still sits on a sample balanced on past vote; it just isn't weighted to registration or party.
That it lands close tells us our sampling did much of the work. Adding past vote and registration to the weights pushed the sample about a point more Democratic, and party identification pulled it back. One election isn't enough to drop political weighting, which protects against exactly the kind of partisan non-response that hurt polls in 2020.
With the full correction, the other alternatives are further away, and in each case we can name why. The three-year party average is 2.2 points too Republican, because it assumes more Republicans than Pew found this year. Recalled vote is 1.7 points too Republican, for the reason we explain below. Keeping leaners as independents is 1.8 points too Democratic, the direction we flagged in October.
At face value, the first two come closer to the result than ours, but only because they pull the sample toward Republicans by about as much as taking every claim of having voted at face value pulls it toward Democrats. Two errors cancel, again.
On this evidence, our weighting wasn't the problem. With the right turnout, it lands between 0.5 points short of the result and 1.5 points over, depending on how much of the reported turnout we treat as overstatement. No alternative does better under every version for a reason we would want to repeat. That's the signature of a turnout problem, not a weighting one.
Past vote: From the profile, not from memory
Most pollsters now weight on how people voted in 2024. Usually, they have to ask people to remember, and people misremember: they overstate having voted, and they drift toward the winner or toward their current views. Our sampling and weighting use a different source: the 2024 vote recorded in each participant's Prolific profile, collected separately from our poll.
We also asked people to recall their 2024 vote in the survey, so we can see what difference it makes. Weighted the same way, 31.8% recalled voting for Harris, against 29.6% according to their profiles (which our weights match to the certified result). Recalled Trump votes were closer (31.3% against 30.5%). Only 35.1% said they didn't vote, against 39.0%.
Morris sees the same drift in his polls: some 2024 Trump voters no longer admit voting for him.
Had we weighted to recalled vote instead, our likely-voter estimate would have been D+9.9 rather than D+10.7, a miss of 3.3 points rather than 2.5. With the right turnout and the full correction, it would have landed 1.7 points short of the like-for-like result, against 0.5 with our weights (see the chart above; at face value it comes closer, for the canceling reason we described).
The mechanism is simple. When more people claim a Harris vote than there were Harris voters, weighting to the true 2024 result shrinks the weight of anyone who says they voted Harris, including some who did. How much this affected other pollsters depends on how their respondents misremember. But if their samples' recall tilted toward Harris the way ours did, weighting on recalled vote would have pushed them toward Republicans by up to a point.
Party identification
Weighting on party identification is debated, because party loyalty can move with the campaign. We used Pew's 2026 figures, counting independents who lean to a party with that party (Democrats ahead by 4.4 points among adults). It sits between the alternatives in the table: without leaners, the sample would have been too Democratic; with the more cautious three-year average, too Republican.
For our published estimate to hit the result through party weighting alone, adults would have needed to identify as Democrats by about 9 points, against about 4 in Pew's survey. No benchmark supports that. You can't weight your way out of a turnout problem.
Are the people who take part in polls different?
The risk for any poll isn't that keen respondents exaggerate. It's that the people who take part differ from those who don't on exactly what the poll is trying to measure (here, whether they vote and for whom) in ways that weighting on demographics, party, and past vote can't see. If they do, no weighting on those variables fixes it.
In October, we ran an experiment to examine this. Half the people who started our survey were first asked which topic they would like to answer questions about. Those who chose politics stand in for the politically keen people overrepresented among poll respondents. They were far more likely to say they would definitely vote (74%) than people who were never offered a choice (56%) or who picked another topic (43%).
Two statistical models that use the random assignment to separate eagerness from everything else, a Heckman selection model and the method Michael Bailey proposes, told the same story. Choosing politics went with a much higher chance of saying you would vote, even among people with the same demographics, party, and past vote, and with no detectable difference in vote choice.
Eagerness to talk politics was also a stable trait, not a passing mood. When we asked the same people again a week before Election Day, the gap in stated turnout between politics-choosers and people who picked another topic was unchanged, at about 31 points.
After the election, we checked what they actually did:
They really did vote more. 82% of those who chose politics say they voted, compared with 66% of those who were never offered a choice and 58% of those who picked another topic. The keen are different in behavior, not just in what they say.
They didn't exaggerate. Comparing people who gave the same October answer about voting, from the same demographic and political groups, those who chose politics voted about 3 points more, not less (95% interval −2 to +7). Among people who said they would definitely vote, 96% of politics-choosers say they voted, compared with 95% of those never offered a choice and 93% of those who picked another topic.
So people who want to take part in political polls differ in turnout.
This also matters for how we treated over-reporting earlier in this piece. If polls over-represent people who really do vote, part of the gap between the 60% turnout our sample reports and the actual 49% is real, not overstatement. That's why we treat the full correction as an upper bound, and why the truth probably lies somewhere between it and face value.
All of this is about the people who take part in our surveys. What it means for people who never take part at all is a harder question. Answering it needs more complex modeling, and a design that randomizes how the survey is described before people decide to take part.
How did other pollsters do?
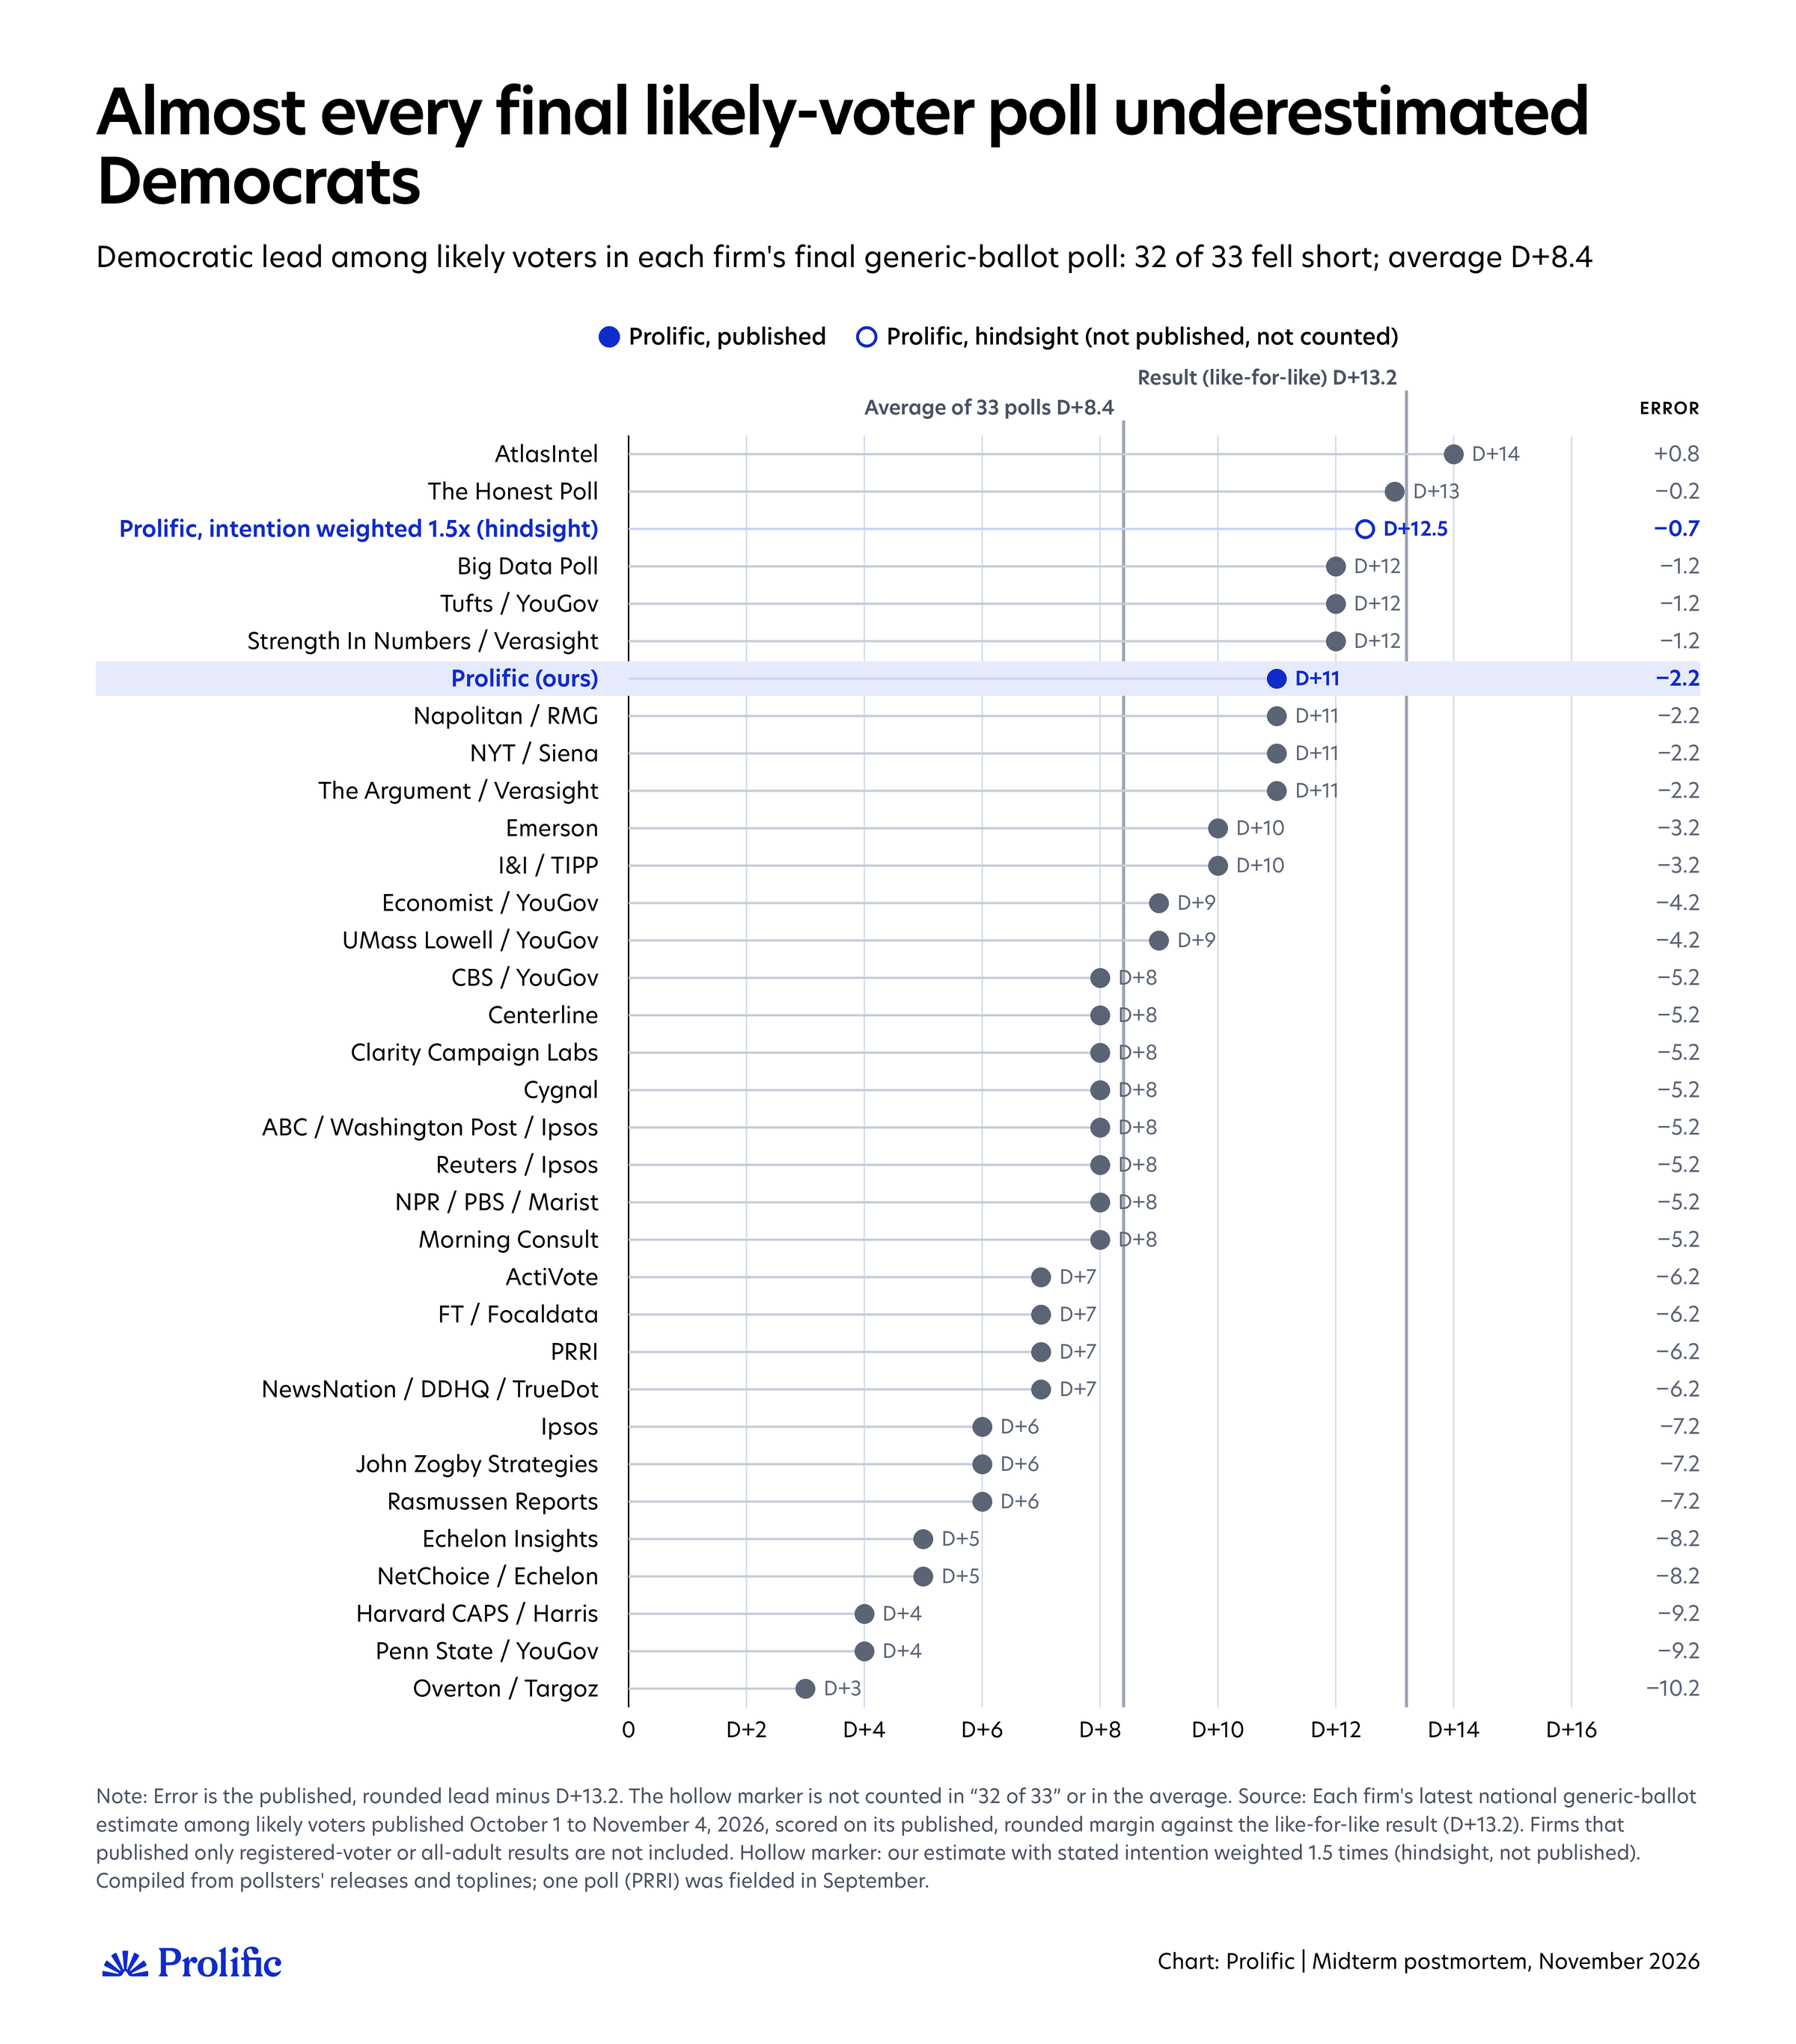
We weren't alone: almost everyone underestimated Democrats. We collected the final generic-ballot estimate among likely voters that each of 33 polling firms, us included, published between October 1 and Election Day. All but one had Democrats ahead by less than the like-for-like result (D+13.2). The average lead was about 8 points, about 5 short.
Our D+11 was among the nine closest. Five firms came closer, with leads of 12 to 14 points: AtlasIntel, The Honest Poll, Big Data Poll, Tufts/YouGov and Strength In Numbers/Verasight.
To treat every firm the same way, we score each one on its published margin rounded to whole points, as most firms report it, so that firms publishing decimals are neither favored nor penalized. On that basis, our D+10.7 counts as D+11, an error of 2.2 points rather than 2.5. The hollow marker shows where we would have landed with stated intention weighted 1.5 times, the change we discussed above: D+12.5, among the closest estimates. That's hindsight, not a number we published.
Each firm's latest national generic-ballot estimate among likely voters published October 1 to November 4, 2026, scored on its published, rounded margin against the like-for-like result (D+13.2). Firms that published only registered-voter or all-adult results are not included. Hollow marker: our estimate with stated intention weighted 1.5 times (hindsight, not published). Compiled from pollsters' releases and toplines; one poll (PRRI) was fielded in September.
How a poll found its respondents made little difference. Polls built on probability samples averaged about D+8, opt-in polls about D+8, and polls mixing the two about D+10. That fits Morris's reading that the problem was not who pollsters reached.
What we'll change
We'll keep our sampling, our weighting, and a turnout model built on past elections. What changes is how we handle that model's known weakness:
We'll develop an approach that gives stated intention the required weight in each election, based on the enthusiasm gap. Counting it 1.5 times as much would have cut this year's miss from 2.5 points to 0.7, and changed almost nothing in 2014 or 2022. We'll fix the rule and test it on more past elections, before the next one, not after.
We'll test adding past midterm voting to the model. People who told us they voted in 2022 turned out 5 to 7 points more than our model expected, because it learns past voting only from the last presidential election.
When our own data show a large enthusiasm gap, we'll treat a 2018-style error as a likely outcome, not a side scenario, and widen our range on that side.
We'll keep weighting on past vote from profiles, not memory. With the right turnout and the full correction, recalled vote would have left us 1.7 points short instead of 0.5.
We'll keep re-interviewing the same people. It's the only way we found to separate who turned out from who changed their mind.
We'll move our experiment to the invitation. Based on our experiment, nonignorable nonresponse may have played a role too, and randomizing at the invitation is one of the most effective ways to assess and account for it.
A few caveats
Whether people voted, and how, is what they told us after the election. People overstate voting, so we show our results three ways: taking people's word for it, with a full correction for overstatement, and halfway between. The main conclusions hold under all three, but the sizes vary. Until we can check our respondents' answers against voting records, these are estimates.
We re-interviewed 1,297 of our 1,518 October respondents (85%). Those who didn't answer had leaned more Democratic in October and were less politically engaged. To estimate whether and how each of the 221 voted, we match respondents who gave the same answers in October and before Election Day and look alike in party, 2024 vote, and demographics. On that basis, about 55% of them voted, taking people's word for it, against 60% of those who answered. This assumes that people who didn't answer behave like similar people who did. If they differ in ways we can't see, the full-sample figures would be off.
The count isn't final. We compare with the count as of November 16, with our projection of the final count, and with two like-for-like versions. Our conclusions don't depend on which one we use.
Many of the groups behind these numbers are small, and each piece of the explanation carries a margin of error of a few points. The direction is consistent across every version we tried; the exact sizes are not.
Comparing a poll's choices with a result after the fact is easy to overdo. One election is one test, and a choice that looks best this year may not be next time, as the simpler turnout model shows.
Methodology: Prolific surveyed 1,518 US adult citizens on October 21–22, 2026 (propensity-score sampling; weighting and turnout model as described in the October article). Between November 4 and 12, we re-contacted all of them; 1,297 answered (85%). Late respondents were offered a higher payment. Analyses of what respondents did use their October weights. Where the full October sample is needed, whether and how the 221 who didn't answer voted was estimated from those who did (a weighted multinomial model on October and pre-election answers, turnout intention, 2024 profile vote, party identification and demographics). Turnout was measured with a question that makes it easy to say you didn't vote; over-reporting was corrected using validated turnout among people who said they voted in the 2014, 2018 and 2022 Cooperative Election Study. The final count was projected from the November 16 count, total ballots cast, and the states still counting. Uncontested districts were estimated from 2024 presidential results by district from The Downballot. Margins of error come from repeating the full procedure on 500 resampled datasets.