The State of HUMAINE
Preference prediction hits a wall at 66%, demographics explain about 1% of how people judge, and the crowd rewards substance over flattery 2.5 to 1. Yet the pooled signal still teaches sycophancy. A state-of-the-project report from 100,000+ human comparisons, and the studies we're running next.
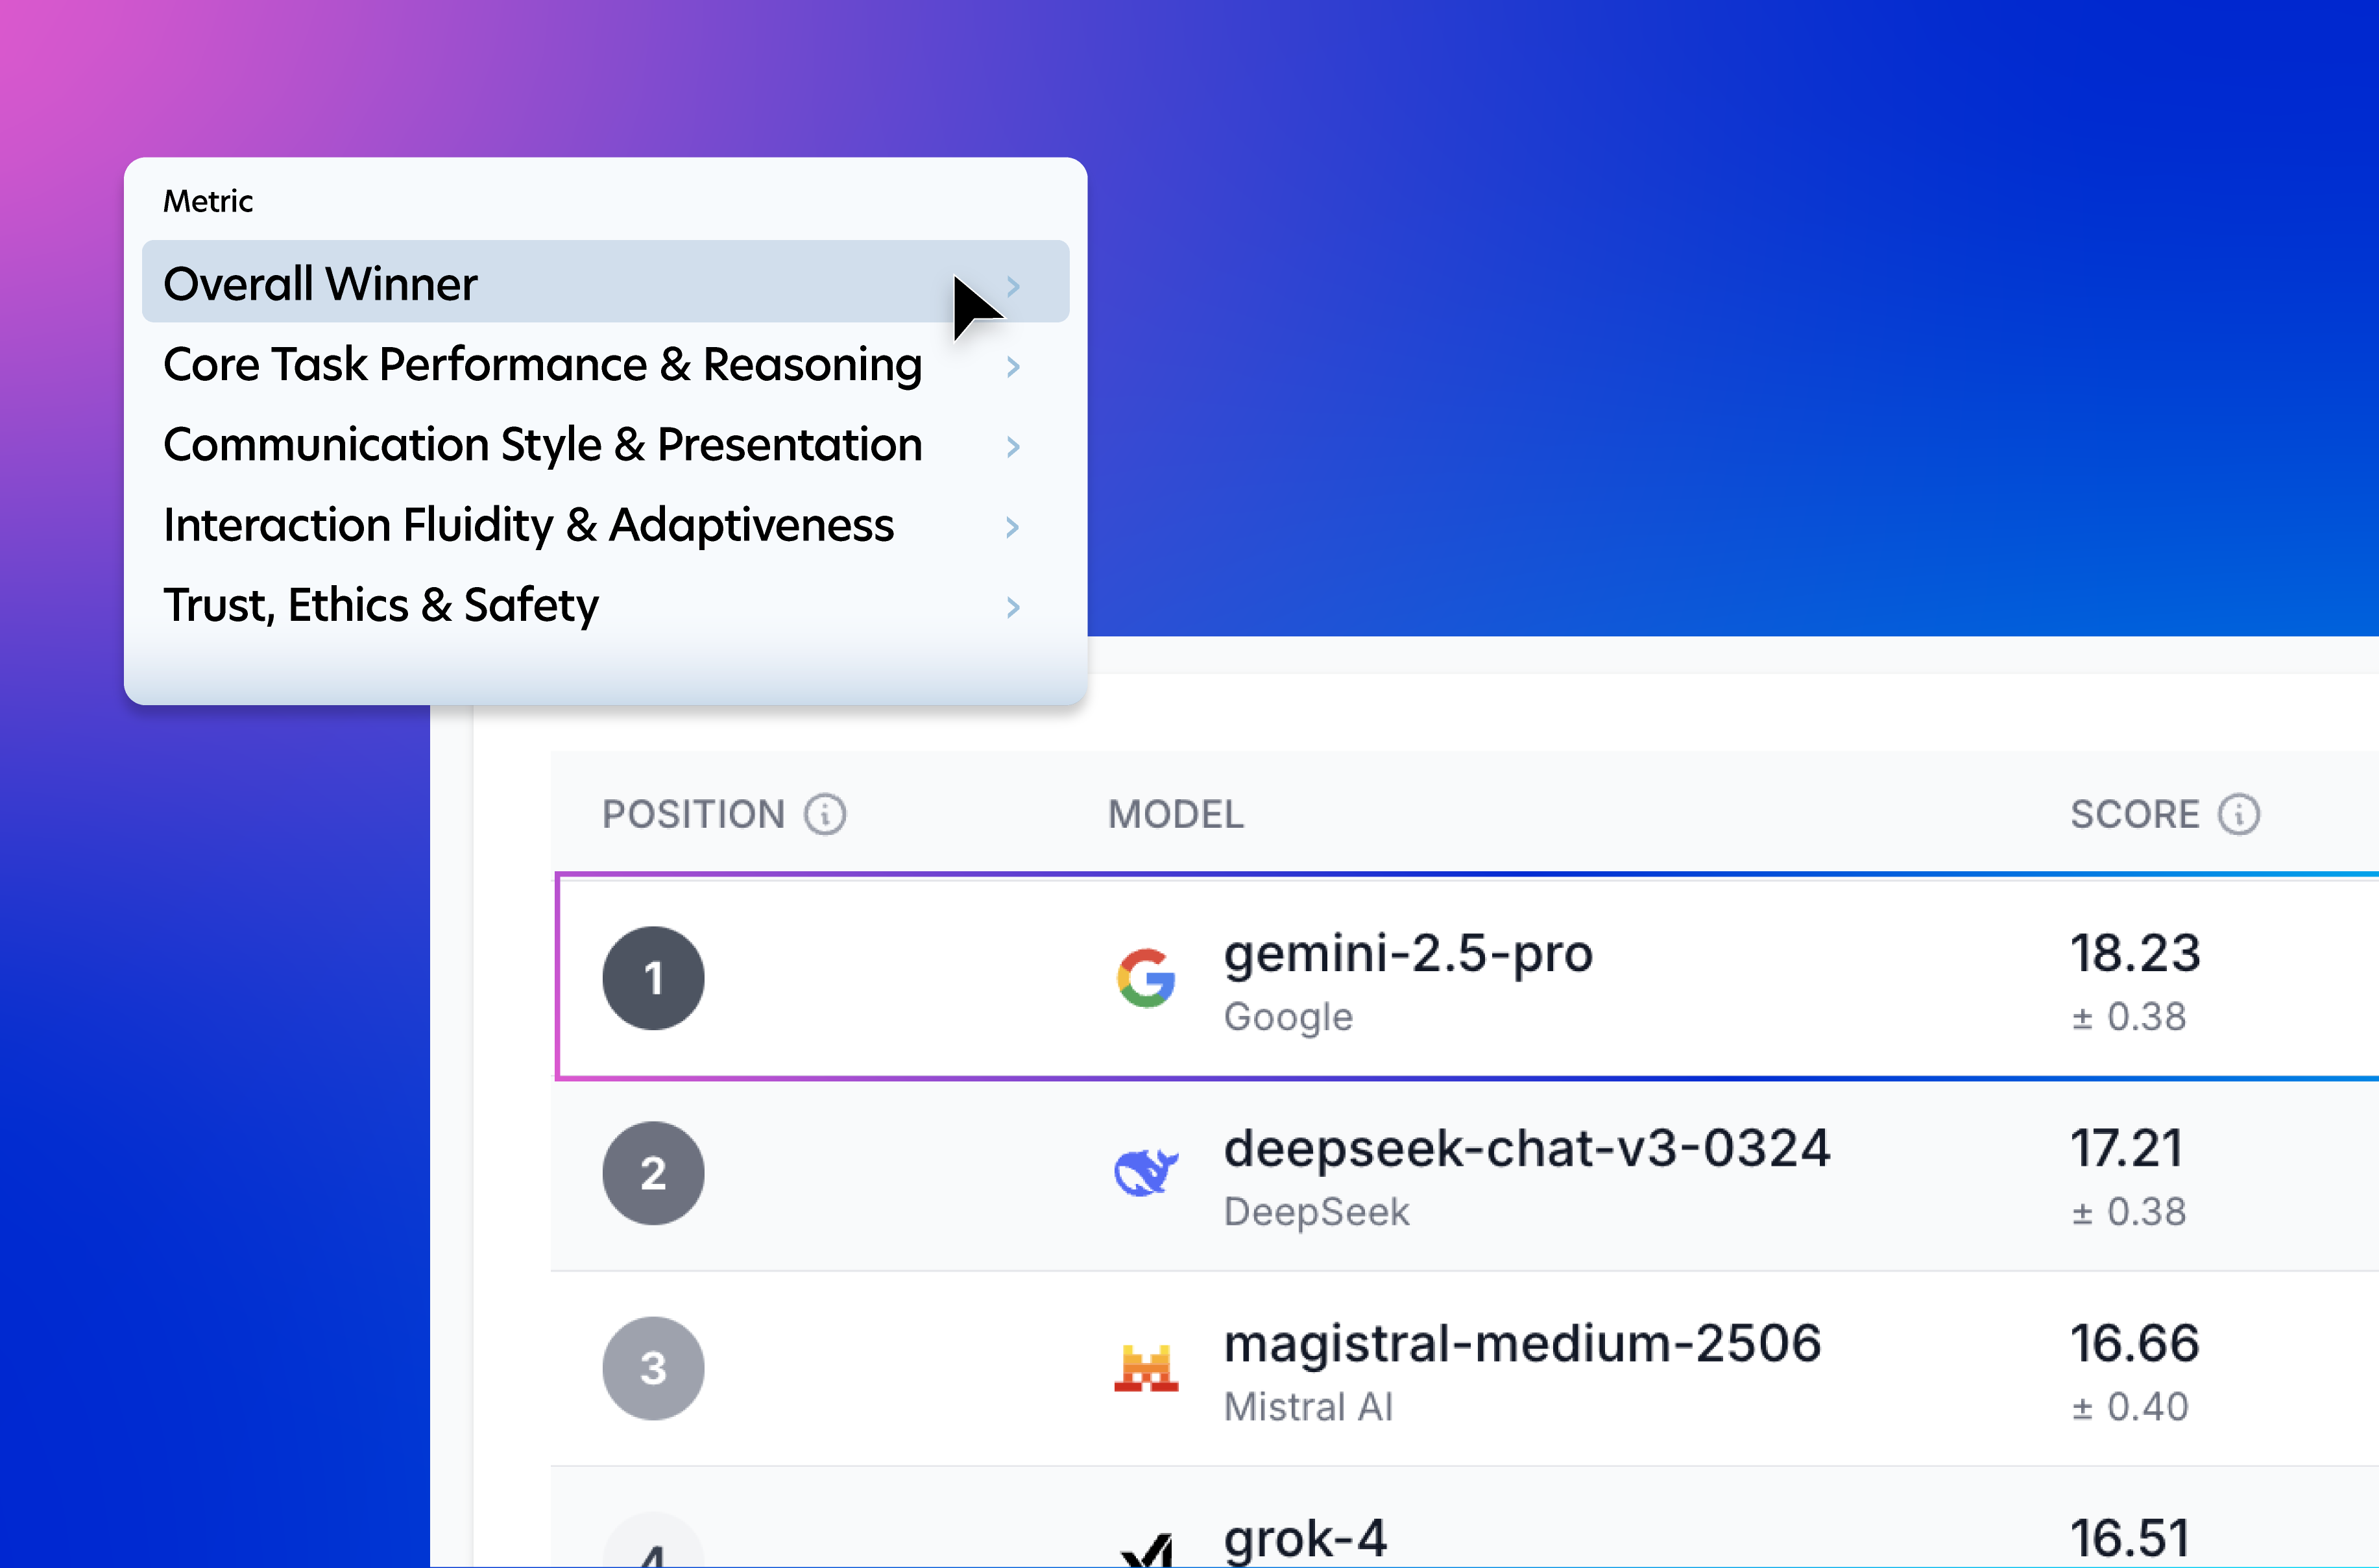
HUMAINE is our ongoing study of how people experience AI. We show a person two anonymised models, let them talk to both about whatever matters to them, and ask them to compare on four dimensions (task performance, communication style, interaction fluidity, and trust/ethics) plus an overall winner. The four dimensions themselves came out of an earlier factor analysis. The current run, through June 2026, covers 51 models, 116,536 classified conversations, 50,769 decisive head-to-head votes, and 23,707 people from the general population across the UK and US.
The short version
A single "which model won" number is really three different measurements rolled into one.
- What's better. Broadly consensual: when people commit to a winner, they mostly agree which response was stronger. Predicting that pick from the conversation caps at about two in three (66%), and the ceiling barely moves no matter what we throw at it.
- How you judge. Personal and stable, but not demographic. People differ in what they weigh and how readily they commit, and the same style recurs within a person across unrelated comparisons. Age, country, education and ethnicity together explain only about 1% of it. Demographics still matter in aggregate; more on that later.
- Earned versus bought. Within "what's better", whether a win was earned (the answer was more effective) or bought (it was longer, or more flattering).
Two findings run against the usual story that RLHF turns models into sycophantic slop. First, the crowd has more taste than the field assumes: substance beats surface in our data by about 2.5 to 1, and length doesn't win. Second, the real risk isn't the crowd but the training signal. Pool every preference together and a genuine sycophancy reward survives, inflated to more than double its true size.
If demographics don't explain how people differ, what does? That's the question the rest of the project is built around. Our bet is on latent factors of disagreement: judgement style, and the psychology underneath it.
What follows is what we learned, and the journey we took to get there.
The wall at 66%
Our first question was the obvious one: can you predict which response a person will pick from the conversation alone? If you can, human evaluation gets cheaper to scale, and the drivers of preference become measurable. If you can't, the shortfall is itself a finding: whatever decides the pick isn't visible in anything you can measure about the conversation.
We built preference predictors the obvious way: extract everything we could from each conversation (length, structure, hedging, sycophancy, plus LLM-judged quality scores) and learn to predict the human's pick, both directly and via a two-stage model that predicts the four sub-dimensions and then combines them.
The result is a hard wall at roughly 66%, and it is remarkably architecture-proof. Tuning, calibration, and dropping the noisiest dimension all land within half a point. Sentence embeddings do worse, at about 59%, because they capture what was discussed rather than how well. Holding raters out of training gives the same number, so it isn't leakage.
Why is accuracy as low as 66% rather than 90%? When the winner is clear, the measured quality gap is more than twice as large and prediction is easy. When the two responses are close, they look similar on everything we can score, and the rater's choice turns on things our features can't see: whether the answer was grounded in their specific situation, whether it committed to a recommendation instead of hedging, whether the quality held from turn to turn. A miss on one of these close calls counts the same as a miss on an easy one, so the hard pairs are what hold the overall number down.
We tried to break the ceiling. It held.
It would be easy to call the remaining 34% "irreducible taste". Before settling for that, we made three serious attempts to break it:
- A side-by-side LLM judge: rather than scoring features, the judge reads both responses and predicts the winner itself, the hope being that it could pick up the holistic quality of a response in a way a fixed feature set can't. We also tried conditioning it on the individual rater's own past reasoning. Accuracy moved by about a point.
- Latent preference-class mixture models gave no lift.
- LLM feature discovery with blind validation: we let a model explain choices it was shown, distilled the explanations into semantic features (personalises-to-user, cites-named-sources, commits-to-a-recommendation, and so on), then re-scored them blind. The blind features made prediction slightly worse, by 1.4 points. The confident explanations were post-hoc rationalisation that didn't survive blind testing.
The honest conclusion is that the signal deciding close calls is not in any representation we could build, whether hand-crafted, LLM-judged or LLM-discovered, nor in any rater profile we had. We are not claiming it's noise. It may be real signal we can't yet extract, or within-person variability, and telling those apart needs a test–retest study that we haven't run.
There's a neat corroboration from a completely different method. When we run factor analysis on the rating instrument itself, a single factor explains 65% of the variance across the five rating responses. In other words, most of what a participant records is one holistic sense of which model they preferred, with the four sub-dimensions acting as partly redundant decompositions of it (a halo effect). If the rating is mostly a single judgement, the best a predictor working from the conversation can do is recover that judgement, so its share of the variance acts as a natural ceiling on accuracy. That share is 65%; our predictors top out at about 66%. The match is probably not a coincidence.
How people judge: the structure underneath
Part of trying to break the ceiling was conditioning on the person: a rater's profile, their past judgements, a judge primed with their own reasoning. None of it helped predict which response wins, and it would be easy to conclude there's no person-level signal at all. There is one, but it lives in a different question: not which response a person picks, but how they decide between them.
We pivoted from asking which response someone picked to asking how the pieces of their judgement fit together. For each vote, did each sub-dimension agree with the overall pick, sit effectively ignored as a tie, or flip against it? That throws away who won and keeps the shape of the decision. Across the 48,864 decisive votes in the run we analysed, a stable structure falls out: recurring judgement archetypes in three families.
| Family | Share | What it means |
|---|---|---|
| Sweep | ~42% | Everything points the same way (no flips; at most one tie). "One was just better." |
| Focus | ~41% | The decision rode on a subset of axes; the rest tied. "Better written," or "more accurate." |
| Flip | ~17% | At least one axis explicitly contradicted the pick. A conscious trade-off. |
The archetype taxonomy is stable (it agrees with itself ~95% across re-fits and bootstraps), and it maps onto what people wrote: the "sources won" pattern clusters in coding and technical questions; the "trust flip" in health, law, relationships, religion; the "style focus" is people choosing the friendlier answer even when it accomplished less.
Two things this tells us:
- Judgement style is partly a trait. Produce an archetype once and you're markedly more likely to produce it again, across different pairs, topics, and sessions: among the 9,681 raters with two or more comparisons, within-person archetype stickiness averages a ×2.7 lift over chance.
- There are recognisable evaluator types. Clustering the 2,386 raters with five or more comparisons on their archetype mixtures gives five recurring types: Selective Reasoners (~40%, the default), Decisive Sweepers (~27%), and three smaller types (~10–13% each) spanning trust-sensitive, trade-off-making, and substance-leaning styles.
That reconciles the two halves of the project. Conditioning on the person doesn't help predict which response wins because the personal signal isn't about what's better; it's about how you decide. The families also track felt strength: asked how likely they'd be to use the winner again (on a 1–5 scale), satisfaction falls from 4.52 for a sweep to 4.40 for a focus to 4.27 for a flip. In percentage terms the drop is small, about 3% from sweep to focus and 6% from sweep to flip, but it is systematic across tens of thousands of votes, and a pooled win rate ignores it entirely: a flip-win counts the same as a sweep on the board.
When we push the taxonomy past the three families to its natural resolution, density based and Bayesian mixture clustering both independently land on around 15 distinct rating patterns, with clear-cut rather than fuzzy assignments. That gives us a 15-archetype vocabulary, and any cohort (a demographic, a country, a model's wins) can be described as a mixture over it: not who they pick, but what kind of judgement they make. We'll use that vocabulary again when we look at how models win.
Demographics aren't the answer
Demographic stratification is how representativeness has always been done: recruit balanced cells of age, country, education and ethnicity, then report that model X is preferred by UK over-55s. We stratify this way too; it's how you keep a sample representative. But as an explanation of why two people disagree it is remarkably weak, and our data is now unambiguous about it.
- The judgement-style families above are essentially unrelated to demographics (Cramér's V ≈ 0.05; the over- or under-representation of any group in any style is about a percentage point).
- Demographic group predicts only ~1% of how engaged a rater is, measured by how much they write in their optional comments.
- The factor structure of the rating instrument is identical across every demographic cohort, UK vs US, 18–34 vs 55+, and across ethnicities; loadings vary by less than 0.04. People in different groups are not using the instrument differently.
So demographics barely move what people prefer or how they judge. Judgement style does. Across the most compared model pairs, win share swings 25 to 40 percentage points between rating archetypes, far more than any demographic axis produces. And an archetype mixture says something demographics can't: not which model a cohort picks, but what kind of judgement it makes.
An archetype is computed from the rating itself, so it describes a judgement rather than predicting one, and it can't substitute for demographics as a recruitment variable. To turn judgement style from a description into a lever, the same structure has to be measured upstream of the rating, from something we know before the person votes. That means measuring the person, and measuring them properly.
Demographics were always a proxy for the person. The finding here is that the proxy is mostly empty. The work is to measure the thing it was standing in for.
Measuring the person
We're recontacting HUMAINE participants with a set of validated measures spanning psychology, attitudes toward AI, decision-making and taste, to ask whether these profiles explain what demographics can't.
We are deliberately disciplined about what this can deliver, because the ceiling work tells us where it is likely to pay off. We don't necessarily expect it to raise the celing of 66% on which model wins: every conditioning on the person we tried left the direction of the pick essentially unmoved. Richer profiles could in principle interact with the conversation features in ways those attempts didn't capture, but the pattern in our data points elsewhere: people largely agree on what's better when they commit, and differ in whether they commit. Decisiveness is driven by the person. A rater's own history roughly doubles the signal on whether they'll commit or call a tie (AUC 0.56 → 0.65–0.70), so the study is scoped to predict decisiveness and weighing of the dimensions, with a preset and deliberately modest bar: beat demographics, which clear an association of just 0.1. If it works, "preferred by high-need-for-closure users who rarely see a clean winner" replaces "preferred by UK over-55s".
How models win
A win rate says a model wins; it doesn't say how, and "how" is the more useful thing. Pulling the data apart, models that do well fall into recognisable buckets.
Consistency wins. The top of the table is held by models that never finish poorly on any of the four dimensions, yet none of them leads a single one; meanwhile, every model that does lead a dimension trails the overall leaders. The aggregate punishes imbalance: for broad deployment, an even profile beats a spike. The board's newest entrant is the first counterexample: claude-fable-5 debuted at #4 of 51 while leading interaction fluidity outright, a spike on a dimension people feel every turn, carried to a top-tier finish despite mid-pack task scores. For everyone else the pattern holds, so it reads as a strong tendency rather than a law.
Correctness is not preference: the reasoning paradox. Reasoning models in our data produce objectively strong individual answers, with top marks for helpfulness, completeness and even trustworthiness, yet land in the bottom half of preference. They read as careful and clinical; in a side-by-side, people gravitate to the response that feels alive. Engagement and completeness are the features that separate the top tier, while tone, clarity and trustworthiness are table stakes rather than differentiators. A model can be more correct and less preferred, and that gap is the central evaluation problem.
Three ways of winning. When we ask via which judgement archetype a model tends to win, models sort into three styles:
- Sweep winners ("just better" across the board): users perceive a clear competence gap. "I really like model A — it's faster, while providing more relevant content."
- Style-focus winners (win on feel and communication, task often a tie): concise, readable, personable. "More like a person", "brought me to tears", sometimes "too stingy" when users wanted depth. These wins rest on feel rather than the task, and they go away when a rater's decision hinges on accuracy.
- Substance-despite-style winners ("rough but right"): users pick them despite slowness or verbosity because the content is richer. "Way too much information", "a thesis every time", "sending one word at a time… VERY slow". They say all of this, and choose them anyway.
The verbosity paradox makes the taste point tangible. For the depth-heavy models, the same trait is their top strength and their top weakness: "more thorough / more comprehensive / deep analysis" sits one bullet away from "walls of text / WAYYYYY too long". The crowd wants substance and punishes padding; winners are if anything slightly more concise. People reward the information, not the word count.
Audiences split, predictably. The geographic split is systematic and holds on the current 51 model data: substance first models skew US favoured and style forward models skew UK favoured. The DeepSeek line and Qwen's flagship, both substance heavy, rank three to four places higher in the US on average across demographic groups, while the Claude Opus and GPT-chat models, more style forward, rank three to four places higher in the UK. A single leaderboard number hides this entirely.
"But didn't demographics explain about 1%?" They did, and this isn't a contradiction; it's the difference between individual and aggregate. The 1% is about predicting a single person: you can't read how someone will vote off their age or country. The split above is aggregate: a small, systematic per-person tilt, averaged over thousands of raters, moves a model's group win rate enough to swing several ranks, especially through a leaderboard middle where adjacent models are near coin flips. Demographics are weak for the individual and real in the aggregate; both hold. This is exactly why we report demographic leaderboards for representativeness but chase latent factors for the why.
Labs are visibly steering. None of this is fixed. Across one generation, Anthropic's Claude line moved from style-first (strong feel, weak task, very verbose) to substance-balanced, dropping the padding and jumping more than ten ranks. OpenAI's gpt-5.4 and gpt-5.5 are among the clearest substance winners in our data, with some of the least sycophantic winning sides, and they rise furthest on the taste board. Google's Gemini family holds the top of both boards by being consistently strong everywhere rather than leading any single dimension. And one lab moved its flagship from among the most sycophantic models in the benchmark to roughly neutral in a single generation.
Preference vs taste
This last stretch of the report is the thread we're most actively pulling on: the difference between preference and taste, and how a clean taste signal can be measured. It will get a fuller treatment of its own in future work; here is where the thinking currently stands.
A preference is a choice treated as a data point: revealed, atomic, aggregable. It's the pairwise pick at the heart of RLHF; collect millions, average, fit a reward model. Taste is not a choice but the faculty that produces good ones, the discriminating sense that an answer is actually good rather than merely liked. Preference is democratic and shallow by design; taste is concentrated and normative. "Taste" entered the evaluation vocabulary as a corrective, because optimising raw aggregate preference reliably produces sycophancy, length bias and confident slop: outputs crowds pick in side-by-side tests that anyone with taste recognises as worse. The worry is that preference without taste regresses to a pleasing, empty mean.
Our data lets us check that worry directly: it is aggregate preference data, the same signal a reward model trains on. So does it actually reward the cheap stuff? To keep the test from being circular, we score the conversations on content metrics that are not the axes people rated.
Mostly, no.
- Length doesn't win. Winners are if anything slightly more concise; only ~15% are the wordier answer.
- Substance wins. "Taste wins" (the more effective answer wins without leaning on length or flattery) outnumber "cheap wins" (won despite being more verbose or flattering, and less effective) by 2.49× [95% CI 2.39–2.60].
- Sycophancy is the exception. Pool everything and the more sycophantic answer wins meaningfully more often (odds ratio 1.33). Decompose by model and about 60% of that is a between-model artefact: weak models that happen to be sycophantic. Strip it out and a genuine within-model sycophancy reward remains (OR 1.12 [1.10–1.15]); holding the matchup fixed, the more sycophantic response still wins a bit more. Substance is the bigger lever (OR 1.28), but the flattery reward is real, and it's the gradient a reward model amplifies. Train on the pooled signal and you chase a sycophancy bonus more than double its real size, one the best models actively avoid.
The taste board.
We rebuilt the ranking as a taste board: model strength net of the surface and affect axes (sycophancy, length, ungrounded confidence), ranking models by the clean signal as a proxy for quality rather than by who got picked. It correlates with the ordinary preference board at ρ = 0.99, because the models that lean on flattery are already near the bottom; removing the pollution barely reorders the top. The signal is in the per-model gap: a positive shift means a model places higher on the taste board than on the preference board, winning on substance that raw preference under credits; a negative shift means surface appeal was flattering its preference rank. The taste board is experimental at this stage, but here is its current top ten:
| Taste rank | Provider | Model | Preference rank | Shift |
|---|---|---|---|---|
| 1 | gemini-3.1-pro-preview | 1 | 0 | |
| 2 | gemini-3.5-flash | 2 | 0 | |
| 3 | gemini-3-pro-preview | 3 | 0 | |
| 4 | Anthropic | claude-fable-5 | 4 | 0 |
| 5 | xAI | grok-4.20-beta | 6 | +1 |
| 6 | Anthropic | claude-opus-4.7 | 9 | +3 |
| 7 | OpenAI | gpt-5.2-chat | 10 | +3 |
| 8 | Qwen | qwen3.7-max | 8 | 0 |
| 9 | DeepSeek | deepseek-v4-flash | 11 | +2 |
| 10 | gemini-2.5-pro | 5 | −5 |
Read the shifts as directional rather than precise: this board is built on the 49,383-vote subset with content features, not the official leaderboard model, and the surface scores are LLM-judged proxies.
So the sycophancy reward is not a ranking distortion; it's a training signal pull. Optimise it and every model drifts more agreeable together, and because a leaderboard only shows relative position, the drift never appears on the board people check.
The reassuring part is that this isn't happening yet at the model level. Newer models are not more sycophantic (the correlation between debut order and sycophancy is roughly +0.01); if anything they win cheap slightly less often. What is drifting is the taste margin, which is compressing: the gap between taste wins and cheap wins has narrowed from about 10 points in mid 2025 to about 6 in 2026, and the share of contests decided on surface has crept from 6.6% toward 9%. That's a crowding effect rather than models getting cheaper. As the field fills with closer models, more head-to-heads are near ties on substance, so a surface tiebreaker decides more of them. The hazard is forward looking: as substance ties proliferate, the within-model flattery reward decides a growing slice of outcomes.
The frontier has already split on this choice. Reasoning style models tend to win by being less sycophantic than their opponent; chat tuned and smaller models lean the other way. Some labs are demonstrably aligning to taste rather than to flattery, and winning with it.
The signals worth optimising, and the ones that pollute
If the goal is models that are actually good rather than merely agreed with, the evaluation has to separate the earned win from the bought one instead of collapsing both into a win rate where the cheap wins hide.
Start with what each signal is actually worth. The table shows the odds ratio that the higher feature side wins, per standard deviation of the A−B content advantage. The within-model column adds a Bradley–Terry model strength control, isolating the response-level effect from "which model is generally better" (n = 49,383 votes, all 51 models):
| Signal | Pooled OR | Within-model OR | Read |
|---|---|---|---|
| Substance (goal-achievement) | 1.49 | 1.28 | The biggest honest lever; survives the model strength control. |
| Sycophancy | 1.33 | 1.12 | A real pull, but ~60% of the pooled effect is a between-model artefact. |
| Verbosity (length) | 0.94 | 0.96 | More verbose does not win. |
We pushed the same decomposition across all fourteen LLM-judged conversation features, with one discriminator: a feature is a distractor if it wins within-model while its reward is decoupled from substance, meaning near-zero correlation with goal-achievement and an effect that survives controlling for it. The load-bearing evidence comes from the features that are not re-scorings of the axes participants rated.
The clean signal: the components of taste. An anchored, non-circular core of goal-achievement, genuine engagement, and grounding in the user's situation. The last two matter because they survive the substance control, adding to quality independently rather than re-labelling it:
- Goal-achievement / substance (within-model OR 1.28): the anchor; the crowd already rewards it 2.5 to 1.
- Genuine engagement (1.31; still 1.23 net of substance): distinct from agreeableness, and the dimension reasoning models under supply.
- Grounding in the user's situation (1.21; 1.17 net of substance): answered my question, for my case.
The distractors: the pollution. These win on affect, not quality:
- Sycophancy / ungrounded praise (within-model OR 1.13): the textbook case. Its correlation with substance is 0.04, and the reward is unchanged after controlling for it. People reward being agreed with regardless of whether the answer was any good. This is the exact gradient not to hand a reward model.
- Ungrounded confidence: the better calibrated response slightly loses (OR 0.91). Appropriately hedged answers are disfavoured while confident, ungrounded certainty is rewarded. It's the "claims that confirm what people want to believe" bias, measured.
- Pooled win rate as the single target: it hides cheap wins and treats a flip-win identically to a clean sweep, even though flip-wins carry measurably lower use-again satisfaction (4.27 vs 4.52).
The exonerated suspect: length. More verbose does not win (OR 0.96, correlation with substance −0.02). Don't optimise length, and don't fear it either: verbose-but-empty loses, while verbose-because-complete wins via completeness.
A caution on optimising to this board (or any preference benchmark). Treat HUMAINE's signal as a training target and you are fitting the proxy, not the thing it proxies. The cheap wins, length and flattery, are the easiest part of the signal to climb, and a model tuned to them is overfitting: it buys in-distribution win rate and pays for it out of distribution, on the population that actually matters, real users with real tasks. Benchmark specific tuning is overfitting, and sycophancy is its most rewarded, most gameable feature. This is also why we don't release conversations, and why we re-validate the archetype taxonomy rather than re-fit it: to keep the target from being memorised. The taste board exists to make the overfitting visible. A model whose preference rank sits well above its taste rank has been climbing the gameable part of the signal, and that gap is the thing to watch.
How to measure taste more faithfully. The instruments we're building:
- The taste board: rank with surface advantages partialled out, reporting the preference-vs-taste rank gap above as the leading indicator.
- Archetype conditional leaderboards: the ranking among users who decide via clean sweep versus among users who flip on trust. Different models win different ones, and the spread is the honest description of how a model wins.
- Satisfaction weighted wins: weight outcomes by felt strength ("use again"), so a sweep counts for more than a flip.
- The test–retest ceiling study: same people, same comparisons, twice, to finally tell whether the residual behind 66% is stable signal we can't yet read or within-person noise. It tells us whether 66% is the floor or just our reach.
Where this goes next
- The psychology study: spanning psychology, attitudes toward AI, decision-making and taste, asking whether they predict evaluator type and decisiveness. The pre-set bar is to beat demographics' ~0.1 association, and it's scoped to how people judge, not which response wins.
- Tracking the flattery gradient over time: now that we can measure the within-model sycophancy reward, watch whether the field drifts as it converges, and which labs hold the line.
- Measuring taste cleanly: the taste board and the signal decomposition above are first instruments, not final ones. Separating the earned win from the bought one is where this work is heading, and it will get a deeper write-up of its own.
Preference is what a crowd picks; taste is whether the pick was any good. The gap between them is where the next round of model quality will be won or lost. A leaderboard rank collapses both into one number, and a demographic cell explains almost none of the difference between two people. The interesting work, and where HUMAINE is going, is pulling those apart: the earned win from the bought one, and the person from the demographic.